Global Construction Sand Market Forecast
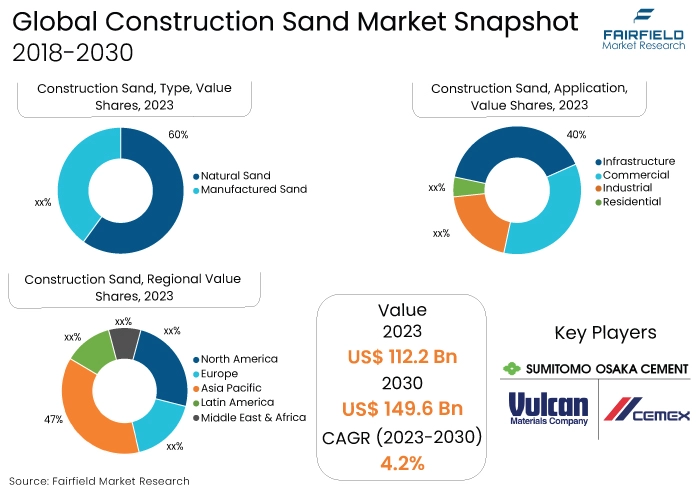
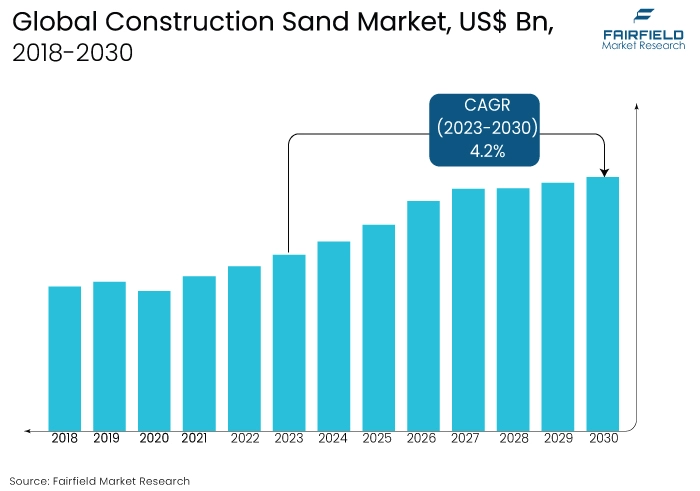
- The approximately US$112.2 Bn market for construction sand (2023) poised to reach US$149.6 Bn in 2030
- Construcion sand market size to expand at a CAGR of US$4.2% between 2023 and 2030
Quick Report Digest
- The construction sand market involves the extraction, processing, and supply of Sand for construction purposes. It's a crucial component in concrete and mortar production, essential for diverse construction projects, from residential buildings to large-scale infrastructure.
- Key drivers include global urbanisation, infrastructure development, and the construction boom. Rising demand for housing, commercial spaces, and public infrastructure fuels the need for construction sand, driving market growth.
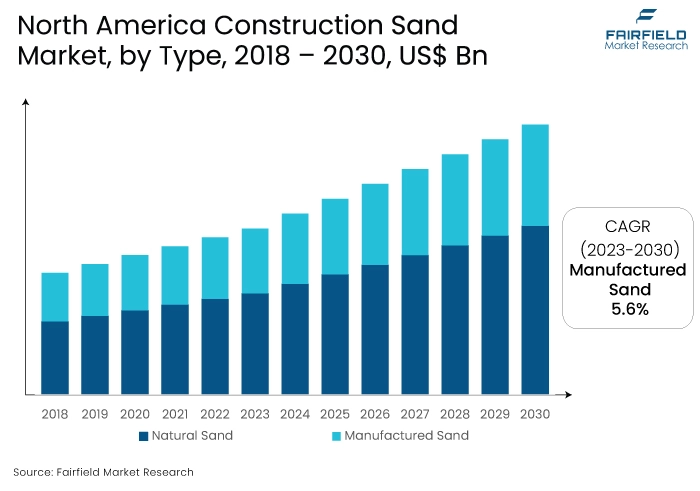
- The market is segmented into natural sand and manufactured sand. Natural Sand, sourced from riverbeds and quarries, remains dominant, while manufactured sand, produced through crushing rocks, gains traction for its consistent quality.
- The largest applications include industrial projects, commercial constructions, residential developments, and infrastructure projects. The versatility of construction sand in various applications contributes to its extensive use across diverse sectors.
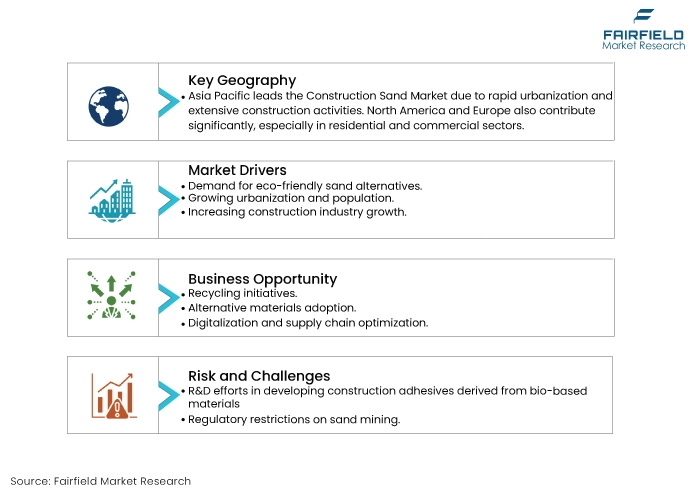
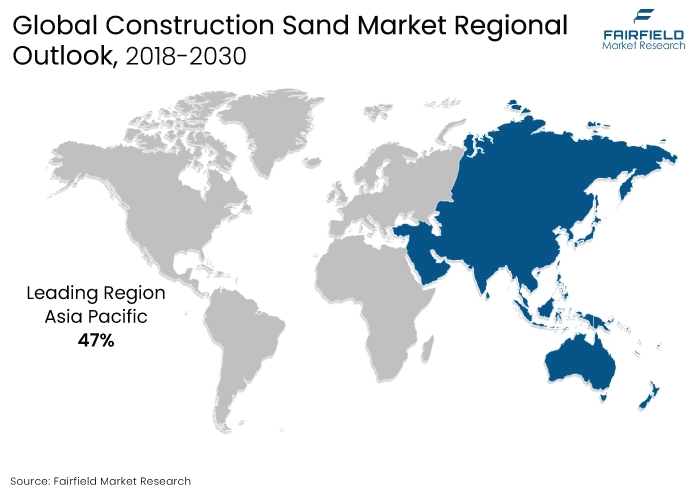
- Asia Pacific leads the construction sand market, driven by rapid urbanisation and extensive construction activities. North America, and Europe contribute significantly, particularly in the residential and commercial sectors. Latin America, the Middle East, and Africa exhibit potential for growth, with increasing infrastructure projects shaping their respective markets.
A Look Back and a Look Forward - Comparative Analysis
The construction sand market is thriving amidst global construction needs. Urbanisation, infrastructure projects, and sustainable practices drive current demand. Market players focus on meeting evolving construction requirements while addressing environmental concerns.
Since 2018, the construction sand market has adapted to urbanisation and construction trends. Advances in extraction methods and environmental considerations have shaped the industry's trajectory, ensuring resilience and meeting the demands of the built environment.
The future foresees sustained demand, integrating smart construction technologies and eco-friendly practices. Innovations in recycling and alternative materials will likely define the construction sand market, aligning with global sustainability goals and ensuring long-term viability.
Key Growth Determinants
- Demand for Eco-friendly Sand Alternatives
The construction sand market experiences a surge in demand for eco-friendly alternatives due to environmental concerns. Stringent regulations and heightened environmental awareness drive the adoption of sustainable practices.
Innovations in recycled and synthetic sand alternatives gain momentum, offering environmentally conscious options to construction companies, aligning with global sustainability goals, and mitigating the ecological impact of traditional sand extraction methods.
- Growing Urbanisation Pace
The construction sand market sees heightened demand propelled by global urbanisation and population growth. Rapid urban expansion requires extensive construction, driving the need for sand in infrastructure, residential, and commercial projects.
As more people move to urban areas, the construction sector, a key consumer of sand, responds to accommodate the growing population, stimulating sustained demand in the market.
- Construction Industry’s Growth
The continuous growth of the global construction industry buoys the construction sand market. Booming infrastructure projects, residential developments, and commercial constructions worldwide contribute to the increasing demand for construction sand.
As economies expand and modernise, the construction sector thrives, driving the need for this essential material and creating a positive outlook for the construction sand market's future.
Major Growth Barriers
- R&D Efforts in Developing Construction Adhesives Derived from Bio-Based Materials
The construction sand market faces a restraint in limited R&D efforts focused on developing construction adhesives from bio-based materials. While eco-friendly alternatives are in demand, the industry encounters challenges in finding sustainable bonding solutions.
The need for innovative adhesives derived from bio-based materials is hindered by the complexity of formulations and the requirement for extensive testing, impeding the swift adoption of environmentally friendly adhesives within the construction sector.
- Regulatory Restrictions on Sand Mining
Regulatory restrictions on sand mining pose a significant constraint on the construction sand market. Stringent environmental regulations and concerns about the ecological impact of sand extraction lead to limitations on mining activities.
These restrictions, often imposed to protect ecosystems and prevent habitat disruption, can result in reduced sand supply, causing supply chain challenges and potential increases in construction costs. Compliance with evolving regulations becomes crucial for industry players to navigate this restraint effectively.
Key Trends and Opportunities to Look at
- Recycling Initiatives
The construction sand market sees a growing trend in recycling initiatives, with companies developing technologies to reuse and recycle construction waste, reducing reliance on traditional sand sources. This trend gains popularity globally, aligning with sustainability goals. Key players invest in recycling technologies, enhancing brand reputation and meeting eco-conscious consumer demands.
- Alternative Materials Adoption
An emerging trend involves the adoption of alternative materials like manufactured sand and industrial by-products. Companies leverage technological advancements to produce high-quality alternatives, gaining popularity in regions with stringent environmental regulations. Brands investing in research and development to enhance the performance of these alternatives position themselves as leaders in sustainable construction practices.
- Digitalisation, and Supply Chain Optimisation
The construction sand market is experiencing a trend toward digitalisation and supply chain optimisation. Companies deploy technologies for real-time monitoring of sand extraction, transportation, and distribution. This trend is widespread, enhancing efficiency and reducing costs. Brands investing in digital solutions showcase innovation, streamline operations, and strengthen their competitive position in diverse regional markets.
How Does the Regulatory Scenario Shape this Industry?
The regulatory scenario profoundly shapes the construction sand market. Stricter environmental standards, safety protocols, and ethical considerations guide the development and deployment of robotic solutions. Regulations addressing workplace safety, emissions, and ethical use of automation influence industry practices. Compliance with these regulations becomes a pivotal factor for market players.
Companies investing in ethical and sustainable robotics, aligning with evolving regulations, position themselves as industry leaders. Regulatory frameworks also drive innovation, pushing the industry towards environmentally friendly and socially responsible solutions and shaping the trajectory of the construction sand market.
Fairfield’s Ranking Board
Top Segments
- Natural Sand Remains the Top-Ranking Category
Natural sand remains the largest segment in the construction sand market. Its abundance and widespread use in traditional construction applications contribute to its dominant market share. While there is a growing interest in alternative materials like manufactured sand, the sheer volume and availability of natural sand sustain its position as the primary type in the market.
Manufactured sand emerges as the fastest-growing segment in the construction sand market. As awareness of environmental concerns grows, and regulations on natural sand extraction tighten, the demand for manufactured sand surges. Companies investing in advanced production technologies and promoting the benefits of manufactured sand capitalise on this trend, driving its rapid adoption.
- Infrstructure Industry Continues to Register Maximum Consumption Rate
Infrastructure stands as the largest application segment in the construction sand market. The demand for sand in large-scale construction projects such as roads, bridges, and other infrastructure developments contributes significantly to this segment's dominance. The robust growth in global infrastructure projects sustains the demand for construction sand in this application.
Residential construction emerges as the fastest-growing application in the construction sand market. Rapid urbanisation, population growth, and a surge in housing projects globally propel the demand for construction sand in residential applications. Companies aligning their strategies with this trend cater to the increasing need for Sand in residential construction, positioning themselves for substantial growth.
Regional Outlook
Revenu Generation Concentrated in Asia Pacific
Asia Pacific holds the largest regional market share in the construction sand market. Rapid urbanisation, extensive infrastructure projects, and a booming construction sector drive the region's dominance. Robust economic growth in countries like China, and India fuels the demand for construction sand.
North America, and Europe also contribute significantly to mature construction industries. Companies operating in these regions benefit from a consistent demand for construction sand, strategic partnerships, and regional expansions to capture market share.
Construction Sand Sales to Take off in the Middle East and Africa
The Middle East and Africa represent the fastest-growing regional markets in the construction sand market. The region experiences a construction boom, with major infrastructure and real estate projects driving the demand for construction sand.
Governments' focus on economic diversification and urban development fuels the construction sector, propelling the need for sand. Companies targeting the Middle East and Africa leverage these growth opportunities, establishing strong market positions through partnerships, expansions, and tailored product offerings.
Fairfield’s Competitive Landscape Analysis
The competitive landscape of the construction sand market is characterised by key leaders such as Vulcan Materials Company, Martin Marietta Materials, Inc., CEMEX S.A.B. de C.V., and CRH plc. These industry giants strategically focus on sustainable practices, technological innovation, and geographic expansions.
Vulcan Materials, a frontrunner, emphasises eco-friendly solutions and efficient supply chain management. Martin Marietta stands out for its robust distribution network and diversified product portfolio. CEMEX leads with a global footprint and commitment to sustainable construction. CRH excels in strategic acquisitions and a comprehensive range of construction materials. The competitive scenario underscores the significance of innovation, sustainability, and strategic alliances for market leadership in the construction sand industry.
Who are the Leaders in the Global Construction Sand Space?
- Vulcan Materials Company
- Martin Marietta Materials, Inc.
- Cemex S.A.B. de C.V.
- HeidelbergCement AG
- CRH plc
- Sumitomo Osaka Cement Co., Ltd.
- LafargeHolcim Ltd.
- Adelaide Brighton Ltd.
- CEMEX S.A.B. de C.V.
- US Concrete, Inc.
Significant Industry Developments
New Product Launch
- December 2023: Cemex is delivering high-resistance and Vertua lower-carbon concretes for the construction of Bogota’s First Metro Line. This project aims to enhance the lives of over a million daily commuters in the largest Colombian city by providing more efficient and sustainable transportation solutions.
- December 2023: Sumitomo Corporation, JFE Steel, Sumitomo Osaka Cement (SOC), Kawasaki Kisen Kaisha, and Woodside Energy have signed a non-binding MOU to jointly explore the feasibility of aggregating CO2 emissions from the Setouchi, and Shikoku regions. The plan involves transporting these emissions to Australia for permanent storage. Sumitomo Osaka Cement, with integrated plants in Setouchi and Shikoku, contributes to the project's unique approach by addressing CO2 emissions from cement production, primarily derived from limestone processes. This initiative aligns with SOC's efforts in Carbon Capture and Utilization (CCU), aiming to mineralise CO2 into artificial limestone under NEDO's Green Innovation Fund Project.
An Expert’s Eye
Demand and Future Growth
The construction sand market anticipates sustained demand, driven by global urbanisation, infrastructure developments, and population growth. The future holds promising opportunities as the construction industry evolves. Innovations in sustainable practices, recycling, and alternative materials will shape the market's trajectory.
Companies investing in eco-friendly solutions and adapting to changing consumer preferences will thrive. The market's future growth hinges on technological advancements, strategic collaborations, and a proactive response to environmental challenges.
Supply Side of the Market
A balance between traditional extraction methods and innovative solutions characterises the supply side of the construction sand market. While natural sand extraction remains prevalent, the industry witnesses a shift towards sustainable practices, recycling initiatives, and the production of alternative materials.
Companies investing in efficient extraction, processing technologies, and environmentally conscious practices strengthen their supply chain resilience. The future supply side is likely to see increased emphasis on responsible sourcing, reduced environmental impact, and advanced logistics to meet the evolving demands of the construction sector.
Global Construction Sand Market is Segmented as Below:
By Type:
- Natural Sand
- Manufactured Sand
By Application:
- Industrial
- Commercial
- Residential
- Infrastructure
By Geographic Coverage:
- North America
- U.S.
- Canada
- Europe
- Germany
- U.K.
- France
- Italy
- Turkey
- Russia
- Rest of Europe
- Asia Pacific
- China
- Japan
- South Korea
- India
- Southeast Asia
- Rest of Asia Pacific
- Latin America
- Brazil
- Mexico
- Argentina
- Rest of Latin America
- Middle East & Africa
- GCC
- South Africa
- Egypt
- Nigeria
- Rest of Middle East & Africa
1. Executive Summary
1.1. Global Construction Sand Market Snapshot
1.2. Future Projections
1.3. Key Market Trends
1.4. Regional Snapshot, by Value, 2023
1.5. Analyst Recommendations
2. Market Overview
2.1. Market Definitions and Segmentations
2.2. Market Dynamics
2.2.1. Drivers
2.2.2. Restraints
2.2.3. Market Opportunities
2.3. Value Chain Analysis
2.4. Porter’s Five Forces Analysis
2.5. Covid-19 Impact Analysis
2.5.1. Supply
2.5.2. Demand
2.6. Impact of Ukraine-Russia Conflict
2.7. Economic Overview
2.7.1. World Economic Projections
2.8. PESTLE Analysis
3. Global Construction Sand Market Outlook, 2018 - 2030
3.1. Global Construction Sand Market Outlook, by Type, Value (US$ Mn), 2018 - 2030
3.1.1. Key Highlights
3.1.1.1. Natural Sand
3.1.1.2. Manufactured Sand
3.2. Global Construction Sand Market Outlook, by Application, Value (US$ Mn), 2018 - 2030
3.2.1. Key Highlights
3.2.1.1. Industrial
3.2.1.2. Commercial
3.2.1.3. Residential
3.2.1.4. Infrastructure
3.3. Global Construction Sand Market Outlook, by Region, Value (US$ Mn), 2018 - 2030
3.3.1. Key Highlights
3.3.1.1. North America
3.3.1.2. Europe
3.3.1.3. Asia Pacific
3.3.1.4. Latin America
3.3.1.5. Middle East & Africa
4. North America Construction Sand Market Outlook, 2018 - 2030
4.1. North America Construction Sand Market Outlook, by Type, Value (US$ Mn), 2018 - 2030
4.1.1. Key Highlights
4.1.1.1. Natural Sand
4.1.1.2. Manufactured Sand
4.2. North America Construction Sand Market Outlook, by Application, Value (US$ Mn), 2018 - 2030
4.2.1. Key Highlights
4.2.1.1. Industrial
4.2.1.2. Commercial
4.2.1.3. Residential
4.2.1.4. Infrastructure
4.3. North America Construction Sand Market Outlook, by Country, Value (US$ Mn), 2018 - 2030
4.3.1. Key Highlights
4.3.1.1. U.S. Construction Sand Market by Type, Value (US$ Mn), 2018 - 2030
4.3.1.2. U.S. Construction Sand Market Application, Value (US$ Mn), 2018 - 2030
4.3.1.3. U.S. Construction Sand Market End-use Industry, Value (US$ Mn), 2018 - 2030
4.3.1.4. Canada Construction Sand Market by Type, Value (US$ Mn), 2018 - 2030
4.3.1.5. Canada Construction Sand Market Application, Value (US$ Mn), 2018 - 2030
4.3.1.6. Canada Construction Sand Market End-use Industry, Value (US$ Mn), 2018 - 2030
4.3.2. BPS Analysis/Market Attractiveness Analysis
5. Europe Construction Sand Market Outlook, 2018 - 2030
5.1. Europe Construction Sand Market Outlook, by Type, Value (US$ Mn), 2018 - 2030
5.1.1. Key Highlights
5.1.1.1. Natural Sand
5.1.1.2. Manufactured Sand
5.2. Europe Construction Sand Market Outlook, by Application, Value (US$ Mn), 2018 - 2030
5.2.1. Key Highlights
5.2.1.1. Industrial
5.2.1.2. Commercial
5.2.1.3. Residential
5.2.1.4. Infrastructure
5.3. Europe Construction Sand Market Outlook, by Country, Value (US$ Mn), 2018 - 2030
5.3.1. Key Highlights
5.3.1.1. Germany Construction Sand Market by Type, Value (US$ Mn), 2018 - 2030
5.3.1.2. Germany Construction Sand Market Application, Value (US$ Mn), 2018 - 2030
5.3.1.3. Germany Construction Sand Market End-use Industry, Value (US$ Mn), 2018 - 2030
5.3.1.4. U.K. Construction Sand Market by Type, Value (US$ Mn), 2018 - 2030
5.3.1.5. U.K. Construction Sand Market Application, Value (US$ Mn), 2018 - 2030
5.3.1.6. U.K. Construction Sand Market End-use Industry, Value (US$ Mn), 2018 - 2030
5.3.1.7. France Construction Sand Market by Type, Value (US$ Mn), 2018 - 2030
5.3.1.8. France Construction Sand Market Application, Value (US$ Mn), 2018 - 2030
5.3.1.9. France Construction Sand Market End-use Industry, Value (US$ Mn), 2018 - 2030
5.3.1.10. Italy Construction Sand Market by Type, Value (US$ Mn), 2018 - 2030
5.3.1.11. Italy Construction Sand Market Application, Value (US$ Mn), 2018 - 2030
5.3.1.12. Italy Construction Sand Market End-use Industry, Value (US$ Mn), 2018 - 2030
5.3.1.13. Turkey Construction Sand Market by Type, Value (US$ Mn), 2018 - 2030
5.3.1.14. Turkey Construction Sand Market Application, Value (US$ Mn), 2018 - 2030
5.3.1.15. Turkey Construction Sand Market End-use Industry, Value (US$ Mn), 2018 - 2030
5.3.1.16. Russia Construction Sand Market by Type, Value (US$ Mn), 2018 - 2030
5.3.1.17. Russia Construction Sand Market Application, Value (US$ Mn), 2018 - 2030
5.3.1.18. Russia Construction Sand Market End-use Industry, Value (US$ Mn), 2018 - 2030
5.3.1.19. Rest of Europe Construction Sand Market by Type, Value (US$ Mn), 2018 - 2030
5.3.1.20. Rest of Europe Construction Sand Market Application, Value (US$ Mn), 2018 - 2030
5.3.1.21. Rest of Europe Construction Sand Market End-use Industry, Value (US$ Mn), 2018 - 2030
5.3.2. BPS Analysis/Market Attractiveness Analysis
6. Asia Pacific Construction Sand Market Outlook, 2018 - 2030
6.1. Asia Pacific Construction Sand Market Outlook, by Type, Value (US$ Mn), 2018 - 2030
6.1.1. Key Highlights
6.1.1.1. Natural Sand
6.1.1.2. Manufactured Sand
6.2. Asia Pacific Construction Sand Market Outlook, by Application, Value (US$ Mn), 2018 - 2030
6.2.1. Key Highlights
6.2.1.1. Industrial
6.2.1.2. Commercial
6.2.1.3. Residential
6.2.1.4. Infrastructure
6.3. Asia Pacific Construction Sand Market Outlook, by Country, Value (US$ Mn), 2018 - 2030
6.3.1. Key Highlights
6.3.1.1. China Construction Sand Market by Type, Value (US$ Mn), 2018 - 2030
6.3.1.2. China Construction Sand Market Application, Value (US$ Mn), 2018 - 2030
6.3.1.3. China Construction Sand Market End-use Industry, Value (US$ Mn), 2018 - 2030
6.3.1.4. Japan Construction Sand Market by Type, Value (US$ Mn), 2018 - 2030
6.3.1.5. Japan Construction Sand Market Application, Value (US$ Mn), 2018 - 2030
6.3.1.6. Japan Construction Sand Market End-use Industry, Value (US$ Mn), 2018 - 2030
6.3.1.7. South Korea Construction Sand Market by Type, Value (US$ Mn), 2018 - 2030
6.3.1.8. South Korea Construction Sand Market Application, Value (US$ Mn), 2018 - 2030
6.3.1.9. South Korea Construction Sand Market End-use Industry, Value (US$ Mn), 2018 - 2030
6.3.1.10. India Construction Sand Market by Type, Value (US$ Mn), 2018 - 2030
6.3.1.11. India Construction Sand Market Application, Value (US$ Mn), 2018 - 2030
6.3.1.12. India Construction Sand Market End-use Industry, Value (US$ Mn), 2018 - 2030
6.3.1.13. Southeast Asia Construction Sand Market by Type, Value (US$ Mn), 2018 - 2030
6.3.1.14. Southeast Asia Construction Sand Market Application, Value (US$ Mn), 2018 - 2030
6.3.1.15. Southeast Asia Construction Sand Market End-use Industry, Value (US$ Mn), 2018 - 2030
6.3.1.16. Rest of Asia Pacific Construction Sand Market by Type, Value (US$ Mn), 2018 - 2030
6.3.1.17. Rest of Asia Pacific Construction Sand Market Application, Value (US$ Mn), 2018 - 2030
6.3.1.18. Rest of Asia Pacific Construction Sand Market End-use Industry, Value (US$ Mn), 2018 - 2030
6.3.2. BPS Analysis/Market Attractiveness Analysis
7. Latin America Construction Sand Market Outlook, 2018 - 2030
7.1. Latin America Construction Sand Market Outlook, by Type, Value (US$ Mn), 2018 - 2030
7.1.1. Key Highlights
7.1.1.1. Natural Sand
7.1.1.2. Manufactured Sand
7.2. Latin America Construction Sand Market Outlook, by Application, Value (US$ Mn), 2018 - 2030
7.2.1. Key Highlights
7.2.1.1. Industrial
7.2.1.2. Commercial
7.2.1.3. Residential
7.2.1.4. Infrastructure
7.3. Latin America Construction Sand Market Outlook, by Country, Value (US$ Mn), 2018 - 2030
7.3.1. Key Highlights
7.3.1.1. Brazil Construction Sand Market by Type, Value (US$ Mn), 2018 - 2030
7.3.1.2. Brazil Construction Sand Market Application, Value (US$ Mn), 2018 - 2030
7.3.1.3. Brazil Construction Sand Market End-use Industry, Value (US$ Mn), 2018 - 2030
7.3.1.4. Mexico Construction Sand Market by Type, Value (US$ Mn), 2018 - 2030
7.3.1.5. Mexico Construction Sand Market Application, Value (US$ Mn), 2018 - 2030
7.3.1.6. Mexico Construction Sand Market End-use Industry, Value (US$ Mn), 2018 - 2030
7.3.1.7. Argentina Construction Sand Market by Type, Value (US$ Mn), 2018 - 2030
7.3.1.8. Argentina Construction Sand Market Application, Value (US$ Mn), 2018 - 2030
7.3.1.9. Argentina Construction Sand Market End-use Industry, Value (US$ Mn), 2018 - 2030
7.3.1.10. Rest of Latin America Construction Sand Market by Type, Value (US$ Mn), 2018 - 2030
7.3.1.11. Rest of Latin America Construction Sand Market Application, Value (US$ Mn), 2018 - 2030
7.3.1.12. Rest of Latin America Construction Sand Market End-use Industry, Value (US$ Mn), 2018 - 2030
7.3.2. BPS Analysis/Market Attractiveness Analysis
8. Middle East & Africa Construction Sand Market Outlook, 2018 - 2030
8.1. Middle East & Africa Construction Sand Market Outlook, by Type, Value (US$ Mn), 2018 - 2030
8.1.1. Key Highlights
8.1.1.1. Natural Sand
8.1.1.2. Manufactured Sand
8.2. Middle East & Africa Construction Sand Market Outlook, by Application, Value (US$ Mn), 2018 - 2030
8.2.1. Key Highlights
8.2.1.1. Industrial
8.2.1.2. Commercial
8.2.1.3. Residential
8.2.1.4. Infrastructure
8.3. Middle East & Africa Construction Sand Market Outlook, by Country, Value (US$ Mn), 2018 - 2030
8.3.1. Key Highlights
8.3.1.1. GCC Construction Sand Market by Type, Value (US$ Mn), 2018 - 2030
8.3.1.2. GCC Construction Sand Market Application, Value (US$ Mn), 2018 - 2030
8.3.1.3. GCC Construction Sand Market End-use Industry, Value (US$ Mn), 2018 - 2030
8.3.1.4. South Africa Construction Sand Market by Type, Value (US$ Mn), 2018 - 2030
8.3.1.5. South Africa Construction Sand Market Application, Value (US$ Mn), 2018 - 2030
8.3.1.6. South Africa Construction Sand Market End-use Industry, Value (US$ Mn), 2018 - 2030
8.3.1.7. Egypt Construction Sand Market by Type, Value (US$ Mn), 2018 - 2030
8.3.1.8. Egypt Construction Sand Market Application, Value (US$ Mn), 2018 - 2030
8.3.1.9. Egypt Construction Sand Market End-use Industry, Value (US$ Mn), 2018 - 2030
8.3.1.10. Nigeria Construction Sand Market by Type, Value (US$ Mn), 2018 - 2030
8.3.1.11. Nigeria Construction Sand Market Application, Value (US$ Mn), 2018 - 2030
8.3.1.12. Nigeria Construction Sand Market End-use Industry, Value (US$ Mn), 2018 - 2030
8.3.1.13. Rest of Middle East & Africa Construction Sand Market by Type, Value (US$ Mn), 2018 - 2030
8.3.1.14. Rest of Middle East & Africa Construction Sand Market Application, Value (US$ Mn), 2018 - 2030
8.3.1.15. Rest of Middle East & Africa Construction Sand Market End-use Industry, Value (US$ Mn), 2018 - 2030
8.3.2. BPS Analysis/Market Attractiveness Analysis
9. Competitive Landscape
9.1. End-use Industry vs End-use Industry Heatmap
9.2. Manufacturer vs End-use Industry Heatmap
9.3. Company Market Share Analysis, 2023
9.4. Competitive Dashboard
9.5. Company Profiles
9.5.1. Vulcan Materials Company
9.5.1.1. Company Overview
9.5.1.2. Product Portfolio
9.5.1.3. Financial Overview
9.5.1.4. Business Strategies and Development
9.5.2. Martin Marietta Materials, Inc.
9.5.2.1. Company Overview
9.5.2.2. Product Portfolio
9.5.2.3. Financial Overview
9.5.2.4. Business Strategies and Development
9.5.3. Cemex S.A.B. de C.V.
9.5.3.1. Company Overview
9.5.3.2. Product Portfolio
9.5.3.3. Financial Overview
9.5.3.4. Business Strategies and Development
9.5.4. HeidelbergCement AG
9.5.4.1. Company Overview
9.5.4.2. Product Portfolio
9.5.4.3. Financial Overview
9.5.4.4. Business Strategies and Development
9.5.5. CRH plc
9.5.5.1. Company Overview
9.5.5.2. Product Portfolio
9.5.5.3. Financial Overview
9.5.5.4. Business Strategies and Development
9.5.6. Sumitomo Osaka Cement Co., Ltd.
9.5.6.1. Company Overview
9.5.6.2. Product Portfolio
9.5.6.3. Financial Overview
9.5.6.4. Business Strategies and Development
9.5.7. LafargeHolcim Ltd.
9.5.7.1. Company Overview
9.5.7.2. Product Portfolio
9.5.7.3. Financial Overview
9.5.7.4. Business Strategies and Development
9.5.8. Adelaide Brighton Ltd.
9.5.8.1. Company Overview
9.5.8.2. Product Portfolio
9.5.8.3. Financial Overview
9.5.8.4. Business Strategies and Development
9.5.9. CEMEX S.A.B. de C.V.
9.5.9.1. Company Overview
9.5.9.2. Product Portfolio
9.5.9.3. Financial Overview
9.5.9.4. Business Strategies and Development
9.5.10. US Concrete, Inc.
9.5.10.1. Company Overview
9.5.10.2. Product Portfolio
9.5.10.3. Financial Overview
9.5.10.4. Business Strategies and Development
10. Appendix
10.1. Research Methodology
10.2. Report Assumptions
10.3. Acronyms and Abbreviations
|
BASE YEAR |
HISTORICAL DATA |
FORECAST PERIOD |
UNITS |
|||
|
2022 |
|
2018 - 2022 |
2023 - 2030 |
Value: US$ Billion |
||
|
REPORT FEATURES |
DETAILS |
|
Type Coverage |
|
|
Application Coverage |
|
|
Geographical Coverage |
|
|
Leading Companies |
|
|
Report Highlights |
Key Market Indicators, Macro-micro economic impact analysis, Technological Roadmap, Key Trends, Driver, Restraints, and Future Opportunities & Revenue Pockets, Porter’s 5 Forces Analysis, Historical Trend (2019-2021), Market Estimates and Forecast, Market Dynamics, Industry Trends, Competition Landscape, Category, Region, Country-wise Trends & Analysis, COVID-19 Impact Analysis (Demand and Supply Chain) |
