Global Engineered Stone Market Forecast
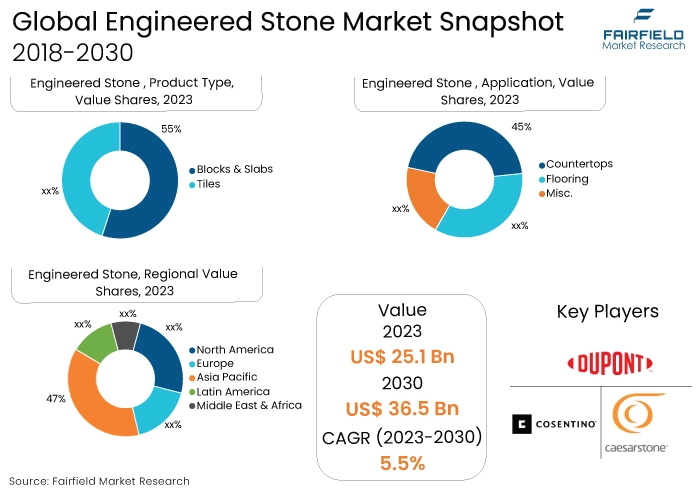
- Global market for engineered stones to reach US$25.1 Bn in 2023 from US$36.5 Bn in 2030
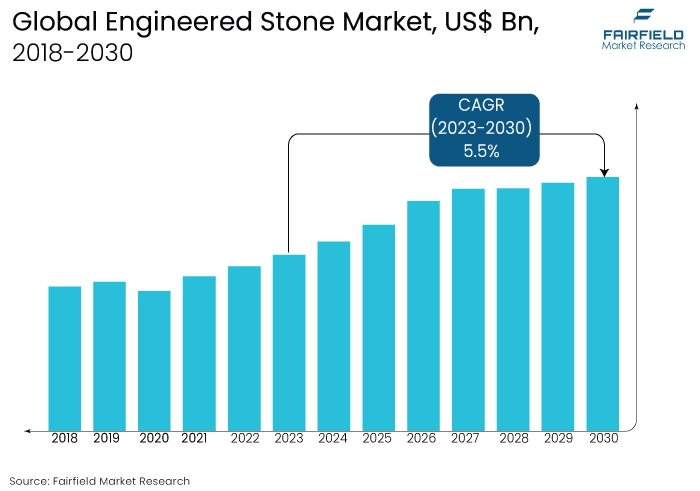
- Engineered stone market size to expand at a CAGR of 5.5% over 2023-2030
Quick Report Digest
- The key trend anticipated to fuel the engineered stone market growth as engineered stones are suitable for applications in hospital kitchens, cafeterias, and commercial buildings because of their impermeable nature and long-lasting properties.
- Another major market trend expected to fuel the Engineered Stone market growth is the increasing demand for long-lasting, visually attractive, and low-maintenance building materials as urbanisation progresses and construction activity increases.
- The market is being supported by the wide array of colours, designs, and textures available, alongside the growing emphasis on sustainable and environmentally friendly building materials
- The engineered stones market is witnessing growth driven by increasing acceptance of these products as environmentally friendly and visually appealing alternatives to natural stones like marble and granite
- In 2023, the blocks & slabs category dominated the industry. The primary reason for this dominance is its ease of installation and maintenance.
- In terms of market share for engineered stone globally, the countertops segment is anticipated to dominate. This segment's prominence is due to its stain-resistant properties and the wide range of design, colour, and texture options available, making it a preferred choice over natural stone.
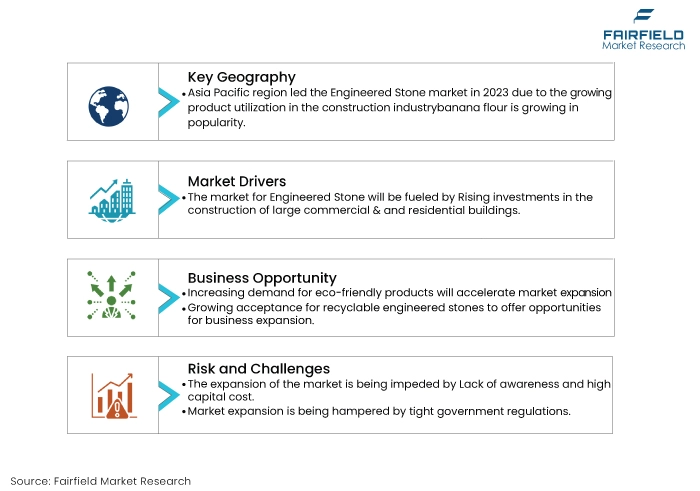
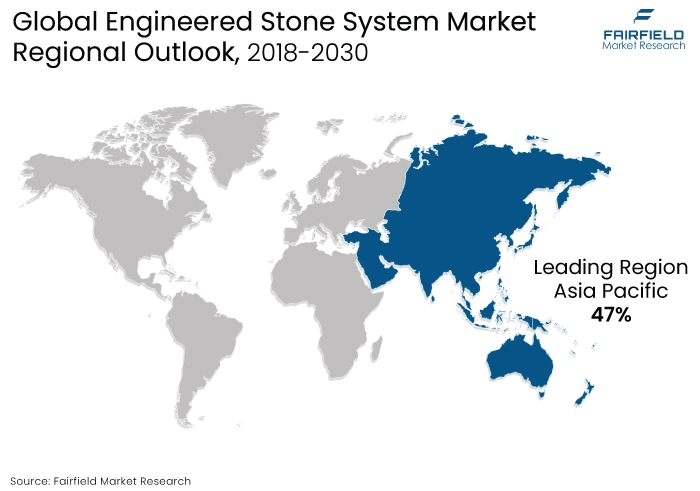
- The Asia Pacific region is anticipated to account for the largest share of the global engineered stone market, owing to increasing demand for energy-efficient construction solutions, coupled with the presence of key industry players in the region.
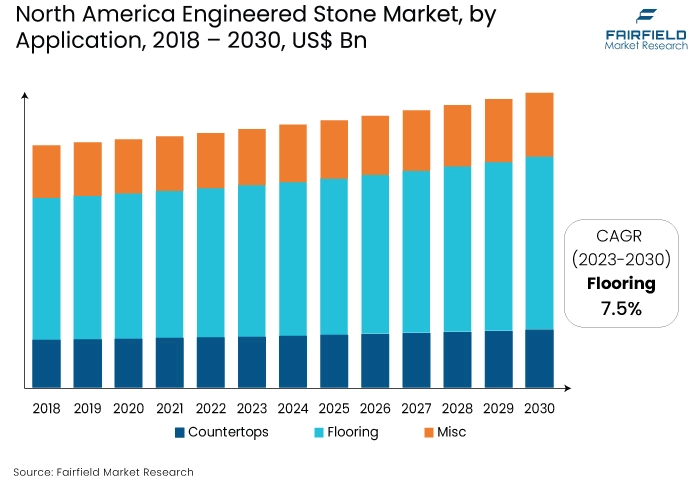
- The market for engineered stone is expanding in North America due to the growing trend of home renovation and remodeling activities.
A Look Back and a Look Forward - Comparative Analysis
The market for engineered stone has grown in popularity as a result of factors such as the surge in demand for resilient and economical materials for various applications such as kitchen countertops, bathroom vanities, flooring, and other interior and exterior applications. Engineered stone, also referred to as quartz or composite stone, is a manufactured material comprising natural quartz and resin binder, providing extensive versatility in design, colour, texture, and pattern.
The market witnessed staggered growth during the historical period 2018 – 2022. This is due to the volatility in raw material prices, along with environmental apprehensions related to waste disposal from manufacturing operations.
The growing awareness of pollution mitigation is opening up avenues for the production of recyclable engineered stone, thereby projected to drive the global market in the forecast period. Certain engineered stone products, like porcelain sinks, liquor bottles, wine bottles, beer bottles, and perfume bottles, comprise up to 70% recyclable material, facilitating the recycling of these products. Additionally, the captivating aesthetics and durability of engineered stone are enhancing its usage in artistic works, thereby expected to create numerous growth opportunities in the global market.
Key Growth Determinants
- Rapid Infrastructure Developments
The engineered stone market is anticipated to witness growth propelled by increasing infrastructure development initiatives. Infrastructure development involves the construction of fundamental services aimed at stimulating economic growth and enhancing the quality of life. Engineered stone, a synthetic material suitable for construction purposes as an alternative to natural marbles or granites, is poised to benefit from the surge in infrastructure projects.
For example, in September 2021, the Indian government unveiled road projects valued at INR 1 lakh crore (US$13.48 billion) to enhance road infrastructure in Jammu and Kashmir. Additionally, the Union Budget 2021 allocated a substantial amount of INR 233,083 crore (US$32.02 billion) to bolster transport infrastructure.
Similarly, in December 2021, the Chinese government earmarked USD 30 billion for infrastructure development in Tibet, including the construction and upgrade of expressways. Under China's 14th Five-Year Plan, approximately 190 billion yuan (US$29.3 billion) is allocated for transportation infrastructure projects from 2021 to 2025.
Consequently, the upsurge in infrastructure development is poised to spur demand for engineered stone in various housing and commercial projects, thereby propelling market growth.
- Urbanisation and Residential Growth
Rapid urbanisation, particularly in emerging economies, coupled with the expansion of residential sectors, is driving significant demand. According to the World Bank, urban dwellers currently make up 56% of the global population, totaling 4.4 billion people. This trend is expected to persist, with urban populations more than doubling by 2050, reaching nearly 7 out of 10 individuals worldwide.
Additionally, according to UNCTAD, the global urban population has been steadily increasing, rising from 52.5% in 2012 to an estimated 56.9% in 2022. Urbanisation rates vary across regions, with higher rates observed in developed countries compared to developing ones. In less developed countries (LDCs), urban populations constitute a minority at 35.8%. Industry analyses indicate a growing preference for attractive and durable infrastructure, which is driving the utilisation of engineered stones.
- Rising Consumer Preference
Engineered stone possesses a plethora of superior characteristics that render it highly sought-after across diverse applications. Its exceptional strength and durability render it particularly suitable for use in areas like kitchen countertops and flooring. Moreover, its remarkable resistance to scratches, stains, and chemicals makes it a low-maintenance choice for both residential and commercial settings.
Additionally, its extensive array of colours, designs, and textures enables consumers to select options that align with their aesthetic preferences. Furthermore, its customisable nature further enhances its allure, empowering consumers to attain personalised designs and sizes tailored to their specific requirements.
Major Restraints
- Rising Material Costs
Construction costs are projected to steadily increase in the forecast period due to a surge in material expenses. The prices of essential construction materials such as cement, lumber, and iron are experiencing rapid escalation. For instance, in Canada, prices for lumber and sawmill products soared by 14.6%, primarily driven by a notable increase of 15.0% in softwood lumber prices in January 2022, following a substantial surge of 31.8% in December 2021.
Similarly, the average cement price across India surged by over 10% to INR 395 ($5.16) per 50 kg bag as of March 22, 2022, compared to the previous month. This represents an 11% increase year-on-year. Consequently, the elevated prices of construction materials are anticipated to adversely impact construction and renovation activities, thereby affecting the demand for engineered stone in the forecast period.
- Environmental and Health Concerns
The incorporation of resins and additives during the production phase can lead to the emission of volatile organic compounds (VOCs), which pose significant environmental and health risks. Prolonged exposure to UV radiation can exacerbate these concerns, potentially resulting in the gradual discolouration and weakening of engineered stones over time.
Despite its inception in the 1980s, additive manufacturing technology remains relatively niche as of 2021. This is primarily due to its slow build rates and inefficiency in scaling operations for high-volume production. Depending on the desired end product, additive manufacturing may require up to three hours to fabricate a shape that traditional processes can produce in a matter of seconds.
Key Trends and Opportunities to Look at
- Booming Construction Sector
The ongoing expansion of the global building and construction industry offers abundant growth opportunities. In the United States, construction spending across various sectors, including manufacturing, highways, transportation, multifamily housing, lodging, and communications, is projected to increase by a minimum of 5% in 2023, as indicated by the firm.
Additionally, sectors such as healthcare, public safety, education, and commerce are expected to experience growth ranging from 0-4%. Notably, in March 2022, Austin, Texas, saw a significant development with 10 million square feet of office space under construction, representing 11.5% of the city's existing stock. Planned projects accounted for 25.3%, marking the highest percentage among major cities. This follows Austin's remarkable performance in 2021, leading in office-using job growth (14%) and new development (5.3 million square feet).
Meanwhile, in China, construction enterprises signed contracts worth approximately CNY 34.5 trillion (US$5.01 trillion) in 2021, comprising over half of the total value. Fuelled by rapid urbanisation, China's construction market surpassed CNY 29 trillion (US$4.21 trillion) in output in the same year. Furthermore, the market is poised to capitalise on the growing acceptance of recyclable engineered stones and the surge in renovation and building activities following the easing of COVID-19 restrictions.
- Growing Demand for Durable and Visually Appealing Materials in Construction and Interior Design Projects
Engineered stone presents an attractive solution for architects, builders, and homeowners seeking a blend of durability and visual appeal. Comprised of crushed natural stones and resins, it offers a robust and enduring material suitable for various applications like countertops, flooring, and wall cladding.
The growing focus on longevity and resilience in construction endeavors, coupled with the demand for aesthetically pleasing surfaces, has spurred the increased adoption of this product. Its capacity to emulate the appearance of natural stone while delivering superior strength and resistance to scratches, stains, and heat renders it well-suited for both residential and commercial ventures.
- Versatile Range of Attributes
The versatile attributes of engineered stones, including their enduring charm and captivating beauty, are projected to draw substantial growth prospects. Engineered stone brings sophistication, and visual allure to various spaces, whether architectural or ornamental, such as statues.
Moreover, recent advancements in the quarrying, extraction, and fabrication processes of engineered stone, such as sandblasting, 3D modeling, and meticulous surface treatments, have enhanced their usability and durability. This is expected to bolster the market share of engineered stone.
How Does the Regulatory Scenario Shape this Industry?
Silicosis is a severe and irreversible lung condition that leads to permanent disability and can even be fatal. Between 2010-11 and 2021-22, there were 551 documented workers’ compensation claims for silicosis in jurisdictions governed by the model WHS laws. Engineered stone workers are disproportionately affected by silicosis, experiencing shorter exposure durations, accelerated disease progression, and higher mortality rates compared to those exposed to silica from natural sources.
On December 13, 2023, Commonwealth, state, and territory governments unanimously agreed to ban the use, supply, and production of all engineered stone, with most jurisdictions implementing the prohibition starting July 1, 2024. This ban on engineered stone usage was recommended in Safe Work Australia’s Decision Regulation Impact Statement: Prohibition on the use of engineered stone, a report commissioned by WHS Ministers in response to the increased incidence of silicosis cases among engineered stone workers.
The prohibition on the use, supply, and manufacture of engineered stone will directly affect companies involved in producing and supplying these materials. It may lead to the closure or reorganisation of manufacturing facilities and supply chains, potentially disrupting the industry's operations
Fairfield’s Ranking Board
Top Segments
- Blocks & Slabs Category Continues to Dominate
The blocks & slabs segment dominated the market in 2023. The prevalence of engineered stone can be attributed to its ease of installation and maintenance. Unlike natural stone, it is notably less susceptible to staining from common food items like oil, wine, and juices, rendering it suitable for kitchen use.
Engineered blocks and slabs can be manufactured in large dimensions, and their non-porous composition enables their application in moisture-prone areas such as bathrooms, swimming pools, showers, and bathtubs. The growing desire for stylish countertops to elevate the visual appeal of interior spaces is expected to drive demand over the forecast period.
Furthermore, the Tiles category is projected to experience the fastest market growth. The surge in demand can be attributed to the wide range of colours, shapes, and sizes available, along with their flexibility to meet specific application and consumer requirements.
Additionally, their composition, which consists of 94 percent crushed leftover stone from quarries, makes them environmentally friendly. Their ease of installation and durability further contribute to their popularity and the expansion of the segment.
- Countertops will Surge Ahead
In 2023, the countertops category dominated the industry. The increased demand can be attributed to the stain-resistant features of the product. Engineered stone slabs, being less expensive than natural alternatives, provide a wider range of options in terms of shape, design, colour, and texture.
However, the engineered stone contains polymeric resins that are not UV stable, leading to discolouration and deterioration of the resin binder when exposed to continuous UV radiation. This exposure causes the binding agents to harden, resulting in a decrease in flexural strength over time, rendering these stones unsuitable for outdoor applications.
The Flooring category is anticipated to grow substantially throughout the projected period. Engineered stone flooring is gaining popularity in kitchens, bathrooms, and below-grade basements due to its water resistance and non-porous structure.
Additionally, it is being increasingly utilised in areas with heavy foot traffic because of its enhanced wear resistance. The miscellaneous segment encompasses applications such as wall and exterior coverings, as well as furnishing items like chairs, and tabletops. The product's superior aesthetics, durability, and resistance to water and stains make it well-suited for use in the furnishing accessories market.
Regional Outlook
Asia Pacific at the Forefront of Consumption
Asia Pacific maintained its dominance in the historical period, This phenomenon can be attributed to the abundance of engineered stone manufacturers in countries such as China, and India. The rapid economic growth in China has significantly reshaped the market landscape, with China now boasting the highest number of producers and the largest overall production volume.
Estimates suggest that China alone is home to over 100 engineered stone distributors. As of December 2012, India had approximately 40 slab manufacturing units. Conversely, the North America region is projected to experience the most rapid growth rate in the coming years. This growth is driven by increasing demand for energy-efficient construction solutions and growing renovation activities in the US, and Canada.
The Energy Conservation Building Code (ECBC) program has resulted in significant electrical energy savings and a reduction in CO2 emissions. Additionally, the Building Energy Efficiency Programme has awarded star ratings to numerous buildings, with a notable increase in star-rated buildings in recent years, leading to substantial energy savings.
North America’s Demand Generation Attributes to Home Renovation and Remodeling Projects
The rising popularity of home renovation and remodeling endeavors is spurring the demand for engineered stone across the region. As per the 2023 US Houzz & Home report, the average homeowner in the US allocated an estimated $8,484 toward various home improvement projects in 2022. CBS News reports indicate a national expenditure of $567 billion on home improvements and repairs during the same year, marking a 15% increase from 2021.
Despite anticipated fluctuations in interest rates in 2023, industry experts anticipate that at least 50% of homeowners will persist in enhancing their properties through home improvements. The US is home to an estimated 588,806 small remodeling businesses as of 2023, reflecting a 2.6% increase from 2022.
Moreover, the growing preference for sustainable and eco-friendly materials is driving the demand for engineered stone. Additionally, the commercial construction sector in the region is embracing engineered stone due to its durability, scratch and stain resistance, and ease of maintenance.
Fairfield’s Competitive Landscape Analysis
The global engineered stone market is a consolidated market with fewer major players present across the globe. Market players are actively investing resources in research and development (R&D) endeavors aimed at introducing innovative products with enhanced performance attributes. Emphasis is placed on customisation options, including a wide array of colours and patterns, to align with the changing design preferences of consumers.
Moreover, sustainability has emerged as a pivotal focal point, prompting numerous companies to integrate eco-friendly practices into their manufacturing processes and provide options using recycled or reclaimed materials. Moreover, Fairfield Market Research is expecting the market to witness more consolidation over the coming years.
Who are the Leaders in Global Engineered Stone Space?
- Cambria
- Caesarstone
- Cosentino Group
- DuPont
- Hanwha L&C Corporation
- Diresco
- Compac
- LG Hausys
- Pokarna Limited
- Teltos Quartz Stone
Significant Company Developments
New Product Launch
- March 2022: In March 2022, Häfele introduced the Terra Quartz surfaces collection, specially crafted for a variety of home applications, renowned for their durability, versatility, and adaptability. With a substantial thickness of 20 mm, this collection primarily showcases Quartz, ensuring exceptional resilience, flexibility, and suitability for artistic craftsmanship.
- March 2021: In March 2021, Stone Italiana, an Italy-based engineered stone manufacturer, launched the Cosmolite range, made from inert pre-consumer recycled materials. This stone received certifications such as LEED v4 Green Gold and NSF 51 Food Contact, boasting low volatile organic compound emissions.
- November 2021: On November 10, 2021, Cambria launched the Cambria Portraits Collection, a new line of engineered quartz countertops. This collection features 12 new designs inspired by natural stone and is backed by Cambria's lifetime warranty.
Distribution Agreement
- March 2022: In March 2022, Engineered Stone Group (ES Group) announced the acquisition of MTI Baths and Aquatica. MTI Baths is renowned for its premium engineered stone, acrylic, and hydrotherapy bathtubs, while Aquatica specialises in high-end solid surface spas and bathtubs, particularly targeting the online direct-to-consumer market in North America. This strategic acquisition is poised to enhance ES Group's footprint in the US market.
- October 2023: In October 2023, Spain's Cosentino expanded its portfolio with the acquisition of Okite, an esteemed Italian brand celebrated for its high-quality quartz surfaces resembling marble. This strategic move significantly strengthens Cosentino's presence in the luxury segment of the engineered stone market.
An Expert’s Eye
Demand and Future Growth
The rise in construction activities worldwide, spanning residential, commercial, and infrastructure sectors, coupled with the surging preference for quartz-based engineered stone, is poised to fuel market expansion.
Furthermore, the escalating demand for visually appealing and long-lasting alternatives to natural stone, along with the increasing adoption of environmentally friendly construction materials, is projected to drive market growth. However, the engineered stone market is expected to face considerable challenges because of high capital costs and a general lack of awareness about the benefits of engineered stone.
Supply Side of the Market
According to our analysis, To meet the growing demand for engineered stone slabs, companies are efficiently scaling up their manufacturing capacities. This expansion enables them to produce larger quantities of engineered stone slabs to satisfy the increasing market requirements.
Major companies are implementing diverse marketing strategies, including offering installation, post-installation, and customisation services, as well as expanding their product portfolios.
For example, Breton S.p.A., a prominent manufacturer, has established a network of authorised workshops in several countries, including Italy, France, China, India, and Brazil. Factors such as brand recognition and customisation services play a crucial role in driving the market share of companies.
Global Engineered Stone Market is Segmented as Below:
By Product Type:
- Tiles
- Blocks & Slabs
By Application:
- Countertops
- Flooring
- Misc
By Geographic Coverage:
- North America
- U.S.
- Canada
- Europe
- Germany
- U.K.
- France
- Italy
- Turkey
- Russia
- Rest of Europe
- Asia Pacific
- China
- Japan
- South Korea
- India
- Southeast Asia
- Rest of Asia Pacific
- Latin America
- Brazil
- Mexico
- Argentina
- Rest of Latin America
- Middle East & Africa
- GCC
- South Africa
- Egypt
- Nigeria
- Rest of the Middle East & Africa
1. Executive Summary
1.1. Global Engineered Stone Market Snapshot
1.2. Future Projections
1.3. Key Market Trends
1.4. Regional Snapshot, by Value, 2022
1.5. Analyst Recommendations
2. Market Overview
2.1. Market Definitions and Segmentations
2.2. Market Dynamics
2.2.1. Drivers
2.2.2. Restraints
2.2.3. Market Opportunities
2.3. Value Chain Analysis
2.4. Porter’s Five Forces Analysis
2.5. Covid-19 Impact Analysis
2.5.1. Supply
2.5.2. Demand
2.6. Impact of Ukraine-Russia Conflict
2.7. Economic Overview
2.7.1. World Economic Projections
2.8. PESTLE Analysis
3. Global Engineered Stone Market Outlook, 2018 - 2030
3.1. Global Engineered Stone Market Outlook, by Product Type, Value (US$ Mn), 2018 - 2030
3.1.1. Key Highlights
3.1.1.1. Tiles
3.1.1.2. Blocks & Slabs
3.2. Global Engineered Stone Market Outlook, by Application, Value (US$ Mn), 2018 - 2030
3.2.1. Key Highlights
3.2.1.1. Countertops
3.2.1.2. Flooring
3.2.1.3. Misc
3.3. Global Engineered Stone Market Outlook, by Region, Value (US$ Mn), 2018 - 2030
3.3.1. Key Highlights
3.3.1.1. North America
3.3.1.2. Europe
3.3.1.3. Asia Pacific
3.3.1.4. Latin America
3.3.1.5. Middle East & Africa
4. North America Engineered Stone Market Outlook, 2018 - 2030
4.1. North America Engineered Stone Market Outlook, by Product Type, Value (US$ Mn), 2018 - 2030
4.1.1. Key Highlights
4.1.1.1. Tiles
4.1.1.2. Blocks & Slabs
4.2. North America Engineered Stone Market Outlook, by Application, Value (US$ Mn), 2018 - 2030
4.2.1. Key Highlights
4.2.1.1. Countertops
4.2.1.2. Flooring
4.2.1.3. Misc
4.2.2. BPS Analysis/Market Attractiveness Analysis
4.3. North America Engineered Stone Market Outlook, by Country, Value (US$ Mn), 2018 - 2030
4.3.1. Key Highlights
4.3.1.1. U.S. Engineered Stone Market by Product Type, Value (US$ Mn), 2018 - 2030
4.3.1.2. U.S. Engineered Stone Market Application, Value (US$ Mn), 2018 - 2030
4.3.1.3. Canada Engineered Stone Market by Product Type, Value (US$ Mn), 2018 - 2030
4.3.1.4. Canada Engineered Stone Market Application, Value (US$ Mn), 2018 - 2030
4.3.2. BPS Analysis/Market Attractiveness Analysis
5. Europe Engineered Stone Market Outlook, 2018 - 2030
5.1. Europe Engineered Stone Market Outlook, by Product Type, Value (US$ Mn), 2018 - 2030
5.1.1. Key Highlights
5.1.1.1. Tiles
5.1.1.2. Blocks & Slabs
5.2. Europe Engineered Stone Market Outlook, by Application, Value (US$ Mn), 2018 - 2030
5.2.1. Key Highlights
5.2.1.1. Countertops
5.2.1.2. Flooring
5.2.1.3. Misc
5.2.2. BPS Analysis/Market Attractiveness Analysis
5.3. Europe Engineered Stone Market Outlook, by Country, Value (US$ Mn), 2018 - 2030
5.3.1. Key Highlights
5.3.1.1. Germany Engineered Stone Market by Product Type, Value (US$ Mn), 2018 - 2030
5.3.1.2. Germany Engineered Stone Market Application, Value (US$ Mn), 2018 - 2030
5.3.1.3. U.K. Engineered Stone Market by Product Type, Value (US$ Mn), 2018 - 2030
5.3.1.4. U.K. Engineered Stone Market Application, Value (US$ Mn), 2018 - 2030
5.3.1.5. France Engineered Stone Market by Product Type, Value (US$ Mn), 2018 - 2030
5.3.1.6. France Engineered Stone Market Application, Value (US$ Mn), 2018 - 2030
5.3.1.7. Italy Engineered Stone Market by Product Type, Value (US$ Mn), 2018 - 2030
5.3.1.8. Italy Engineered Stone Market Application, Value (US$ Mn), 2018 - 2030
5.3.1.9. Turkey Engineered Stone Market by Product Type, Value (US$ Mn), 2018 - 2030
5.3.1.10. Turkey Engineered Stone Market Application, Value (US$ Mn), 2018 - 2030
5.3.1.11. Russia Engineered Stone Market by Product Type, Value (US$ Mn), 2018 - 2030
5.3.1.12. Russia Engineered Stone Market Application, Value (US$ Mn), 2018 - 2030
5.3.1.13. Rest of Europe Engineered Stone Market by Product Type, Value (US$ Mn), 2018 - 2030
5.3.1.14. Rest of Europe Engineered Stone Market Application, Value (US$ Mn), 2018 - 2030
5.3.2. BPS Analysis/Market Attractiveness Analysis
6. Asia Pacific Engineered Stone Market Outlook, 2018 - 2030
6.1. Asia Pacific Engineered Stone Market Outlook, by Product Type, Value (US$ Mn), 2018 - 2030
6.1.1. Key Highlights
6.1.1.1. Tiles
6.1.1.2. Blocks & Slabs
6.2. Asia Pacific Engineered Stone Market Outlook, by Application, Value (US$ Mn), 2018 - 2030
6.2.1. Key Highlights
6.2.1.1. Countertops
6.2.1.2. Flooring
6.2.1.3. Misc
6.2.2. BPS Analysis/Market Attractiveness Analysis
6.3. Asia Pacific Engineered Stone Market Outlook, by Country, Value (US$ Mn), 2018 - 2030
6.3.1. Key Highlights
6.3.1.1. China Engineered Stone Market by Product Type, Value (US$ Mn), 2018 - 2030
6.3.1.2. China Engineered Stone Market Application, Value (US$ Mn), 2018 - 2030
6.3.1.3. Japan Engineered Stone Market by Product Type, Value (US$ Mn), 2018 - 2030
6.3.1.4. Japan Engineered Stone Market Application, Value (US$ Mn), 2018 - 2030
6.3.1.5. South Korea Engineered Stone Market by Product Type, Value (US$ Mn), 2018 - 2030
6.3.1.6. South Korea Engineered Stone Market Application, Value (US$ Mn), 2018 - 2030
6.3.1.7. India Engineered Stone Market by Product Type, Value (US$ Mn), 2018 - 2030
6.3.1.8. India Engineered Stone Market Application, Value (US$ Mn), 2018 - 2030
6.3.1.9. Southeast Asia Engineered Stone Market by Product Type, Value (US$ Mn), 2018 - 2030
6.3.1.10. Southeast Asia Engineered Stone Market Application, Value (US$ Mn), 2018 - 2030
6.3.1.11. Rest of Asia Pacific Engineered Stone Market by Product Type, Value (US$ Mn), 2018 - 2030
6.3.1.12. Rest of Asia Pacific Engineered Stone Market Application, Value (US$ Mn), 2018 - 2030
6.3.2. BPS Analysis/Market Attractiveness Analysis
7. Latin America Engineered Stone Market Outlook, 2018 - 2030
7.1. Latin America Engineered Stone Market Outlook, by Product Type, Value (US$ Mn), 2018 - 2030
7.1.1. Key Highlights
7.1.1.1. Tiles
7.1.1.2. Blocks & Slabs
7.2. Latin America Engineered Stone Market Outlook, by Application, Value (US$ Mn), 2018 - 2030
7.2.1. Key Highlights
7.2.1.1. Countertops
7.2.1.2. Flooring
7.2.1.3. Misc
7.2.2. BPS Analysis/Market Attractiveness Analysis
7.3. Latin America Engineered Stone Market Outlook, by Country, Value (US$ Mn), 2018 - 2030
7.3.1. Key Highlights
7.3.1.1. Brazil Engineered Stone Market by Product Type, Value (US$ Mn), 2018 - 2030
7.3.1.2. Brazil Engineered Stone Market Application, Value (US$ Mn), 2018 - 2030
7.3.1.3. Mexico Engineered Stone Market by Product Type, Value (US$ Mn), 2018 - 2030
7.3.1.4. Mexico Engineered Stone Market Application, Value (US$ Mn), 2018 - 2030
7.3.1.5. Argentina Engineered Stone Market by Product Type, Value (US$ Mn), 2018 - 2030
7.3.1.6. Argentina Engineered Stone Market Application, Value (US$ Mn), 2018 - 2030
7.3.1.7. Rest of Latin America Engineered Stone Market by Product Type, Value (US$ Mn), 2018 - 2030
7.3.1.8. Rest of Latin America Engineered Stone Market Application, Value (US$ Mn), 2018 - 2030
7.3.2. BPS Analysis/Market Attractiveness Analysis
8. Middle East & Africa Engineered Stone Market Outlook, 2018 - 2030
8.1. Middle East & Africa Engineered Stone Market Outlook, by Product Type, Value (US$ Mn), 2018 - 2030
8.1.1. Key Highlights
8.1.1.1. Tiles
8.1.1.2. Blocks & Slabs
8.2. Middle East & Africa Engineered Stone Market Outlook, by Application, Value (US$ Mn), 2018 - 2030
8.2.1. Key Highlights
8.2.1.1. Countertops
8.2.1.2. Flooring
8.2.1.3. Misc
8.2.2. BPS Analysis/Market Attractiveness Analysis
8.3. Middle East & Africa Engineered Stone Market Outlook, by Country, Value (US$ Mn), 2018 - 2030
8.3.1. Key Highlights
8.3.1.1. GCC Engineered Stone Market by Product Type, Value (US$ Mn), 2018 - 2030
8.3.1.2. GCC Engineered Stone Market Application, Value (US$ Mn), 2018 - 2030
8.3.1.3. South Africa Engineered Stone Market by Product Type, Value (US$ Mn), 2018 - 2030
8.3.1.4. South Africa Engineered Stone Market Application, Value (US$ Mn), 2018 - 2030
8.3.1.5. Egypt Engineered Stone Market by Product Type, Value (US$ Mn), 2018 - 2030
8.3.1.6. Egypt Engineered Stone Market Application, Value (US$ Mn), 2018 - 2030
8.3.1.7. Nigeria Engineered Stone Market by Product Type, Value (US$ Mn), 2018 - 2030
8.3.1.8. Nigeria Engineered Stone Market Application, Value (US$ Mn), 2018 - 2030
8.3.1.9. Rest of Middle East & Africa Engineered Stone Market by Product Type, Value (US$ Mn), 2018 - 2030
8.3.1.10. Rest of Middle East & Africa Engineered Stone Market Application, Value (US$ Mn), 2018 - 2030
8.3.2. BPS Analysis/Market Attractiveness Analysis
9. Competitive Landscape
9.1. Capacity vs Application Heatmap
9.2. Manufacturer vs Application Heatmap
9.3. Company Market Share Analysis, 2022
9.4. Competitive Dashboard
9.5. Company Profiles
9.5.1. Cambria
9.5.1.1. Company Overview
9.5.1.2. Product Portfolio
9.5.1.3. Financial Overview
9.5.1.4. Business Strategies and Development
9.5.2. Caesarstone
9.5.2.1. Company Overview
9.5.2.2. Product Portfolio
9.5.2.3. Financial Overview
9.5.2.4. Business Strategies and Development
9.5.3. Cosentino Group
9.5.3.1. Company Overview
9.5.3.2. Product Portfolio
9.5.3.3. Financial Overview
9.5.3.4. Business Strategies and Development
9.5.4. DuPont
9.5.4.1. Company Overview
9.5.4.2. Product Portfolio
9.5.4.3. Financial Overview
9.5.4.4. Business Strategies and Development
9.5.5. Hanwha L&C Corporation
9.5.5.1. Company Overview
9.5.5.2. Product Portfolio
9.5.5.3. Financial Overview
9.5.5.4. Business Strategies and Development
9.5.6. Diresco
9.5.6.1. Company Overview
9.5.6.2. Product Portfolio
9.5.6.3. Financial Overview
9.5.6.4. Business Strategies and Development
9.5.7. Compac
9.5.7.1. Company Overview
9.5.7.2. Product Portfolio
9.5.7.3. Financial Overview
9.5.7.4. Business Strategies and Development
9.5.8. LG Hausys
9.5.8.1. Company Overview
9.5.8.2. Product Portfolio
9.5.8.3. Financial Overview
9.5.8.4. Business Strategies and Development
9.5.9. Pokarna Limited
9.5.9.1. Company Overview
9.5.9.2. Product Portfolio
9.5.9.3. Business Strategies and Development
9.5.10. Teltos Quartz Stone
9.5.10.1. Company Overview
9.5.10.2. Product Portfolio
9.5.10.3. Financial Overview
9.5.10.4. Business Strategies and Development
10. Appendix
10.1. Research Methodology
10.2. Report Assumptions
10.3. Acronyms and Abbreviations
|
BASE YEAR |
HISTORICAL DATA |
FORECAST PERIOD |
UNITS |
|||
|
2022 |
|
2018 - 2022 |
2023 - 2030 |
Value: US$ Million |
||
|
REPORT FEATURES |
DETAILS |
|
Product Type Coverage |
|
|
Application Coverage |
|
|
Geographical Coverage |
|
|
Leading Companies |
|
|
Report Highlights |
Key Market Indicators, Macro-micro economic impact analysis, Technological Roadmap, Key Trends, Driver, Restraints, and Future Opportunities & Revenue Pockets, Porter’s 5 Forces Analysis, Historical Trend (2019-2021), Market Estimates and Forecast, Market Dynamics, Industry Trends, Competition Landscape, Category, Region, Country-wise Trends & Analysis, COVID-19 Impact Analysis (Demand and Supply Chain) |
