Global Graphene Market Forecast
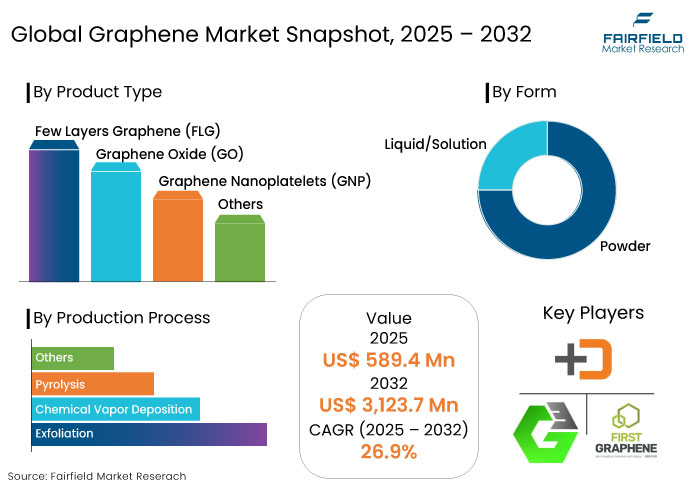
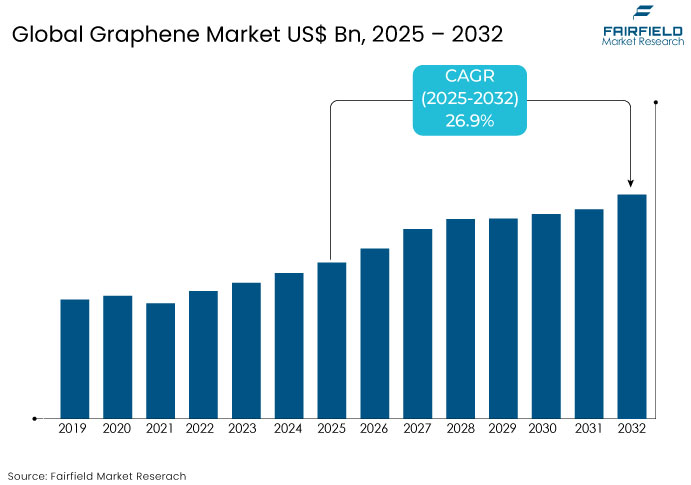
- The graphene market is projected to reach US$ 3,123.7 Mn by 2032 from US$ 589.4 Mn estimated in 2025.
- The graphene market is set to show a significant CAGR of 26.9% from 2025 to 2032.

Graphene Market Insights
- Rising use of graphene in energy storage solutions is driving the market forward.
- Graphene is being integrated into the automotive sector to improve batteries for Electric Vehicles (EVs).
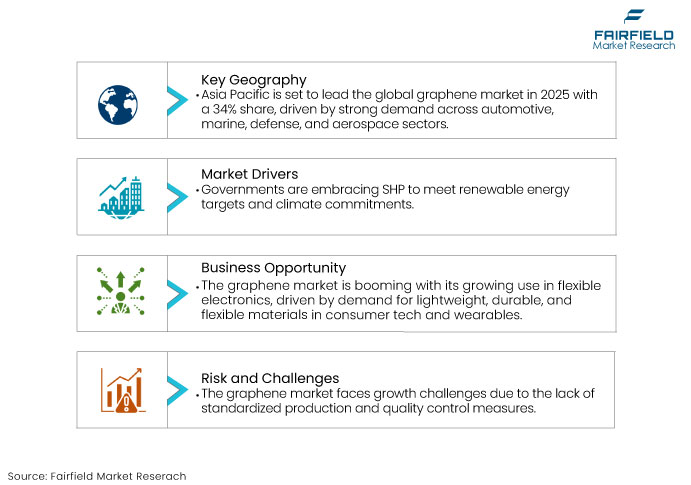
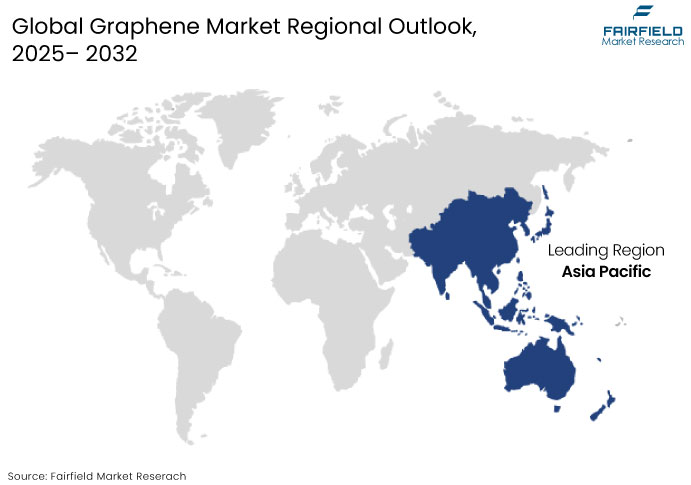
- Asia Pacific is set to hold a 34% market share in 2025 due to booming automotive, aerospace, and defense manufacturing sectors.
- Graphene's ability to boost solar panel efficiency and store renewable energy makes it significant for sustainable energy solutions.
- By product type, graphene oxide is set to dominate by holding 47% market share in 2025.
- Rising demand for lightweight vehicles and their components is set to augment demand for graphene composites.
- Government support and funding for graphene research and development activities is set to boost market growth.
Key Growth Determinants
- Rising Demand for Graphene in Electronics and Energy Storage
One of the key growth drivers in the graphene market is the increasing demand for graphene-based materials in electronics and energy storage solutions. As industries prioritize lightweight, durable, and efficient materials, graphene's exceptional conductivity and strength make it an ideal choice.
In the electronics sector, graphene is being explored for applications in flexible displays, smartphones, and wearables, where its lightweight nature enhances performance without compromising durability. Graphene super-capacitors are believed to offer up to 5 times higher energy density and 10 times faster charging times than traditional capacitors. It could revolutionize energy storage, especially in EVs and renewable energy systems.
- Government Support and Funding for Graphene Research
Another critical driver of the graphene market's growth is the increasing level of government support and funding dedicated to research and development. Governments worldwide recognize the transformative potential of graphene and invest heavily in its commercialization.
The European Union’s (EU) Graphene Flagship program, launched in 2013, is one of the largest research and development initiatives ever funded by the EU, with a €1 billion budget over a 10-year period. Several countries, including China, the U.S., and the EU, have launched initiatives to fund graphene research and development to promote innovation in the electronics and automotive industries.

Key Growth Barriers
- Lack of Standardized Quality and Production Techniques
A key restraint hindering growth of the graphene market is the lack of standardized production techniques and quality control measures. As the graphene industry is still in its early stages of development, there is no universally accepted standard for producing high-quality graphene.
Different production methods, such as chemical exfoliation, liquid-phase exfoliation, and mechanical exfoliation yield graphene with varying properties, which can affect its performance in different applications. The absence of quality control and consistency in production methods makes it difficult for manufacturers to meet the stringent requirements of electronics and energy storage industries.
Graphene Market Trends and Opportunities
- Surging Use of Graphene in Flexible Electronics
A significant trend in the graphene market is the rising adoption of the material in flexible electronics. As industries, particularly in the consumer electronics and wearables sectors, continue to innovate, there is a high demand for materials that combine lightweight, durability, and flexibility.
With its incredible mechanical strength, high conductivity, and flexibility, graphene is perfectly suited for next-generation flexible displays, smart textiles, and bendable smartphones. The electronics industry is shifting toward more portable and multifunctional devices, driving the need for components that are not only compact but also capable of withstanding the rigors of daily use.
- Adoption of Graphene in Energy Storage Solutions
One of the most promising opportunities in the graphene market lies in its application in energy storage solutions, particularly in developing batteries and super-capacitors. With the rapid development of renewable energy technologies and the ever-increasing demand for energy-efficient solutions, there is a significant opportunity for graphene to transform energy storage systems.
Graphene's high surface area and excellent electrical conductivity make it ideal for next-generation batteries and super-capacitors. It offers faster charging times, enhanced capacity, and longer lifespans. As the world shifts toward EVs and sustainable energy sources, demand for high-performance energy storage solutions will continue to rise.

Segments Covered in the Report
- Graphene Oxide to Lead Amid Applications in Disease Detection
By product type, graphene oxide is projected to lead the global graphene market through 2032. Graphene oxide is an oxidized variant of graphene characterized by a substantial surface area suitable for utilization as electrode material in capacitors, batteries, and solar cells. It is utilized with various polymers and materials to improve the characteristics of composite materials, including elasticity, conductivity, and tensile strength.
Graphene oxide exhibits fluorescence, making it appropriate for applications in bio-sensing, disease detection, antibacterial materials, and drug delivery systems. Several electrical devices, including Graphene-based Field Effect Transistors (GFET), are constructed using graphene oxide. Increasing utilization of graphene oxide across diverse end-use sectors is likely to drive market growth.
- Automotive Industry to Seek High-quality Graphene
Based on end use industry, the automotive segment will likely lead the global graphene market in the foreseeable future. Growth of this industry is set to be linked to the rising purchasing power and disposable income of middle-class population in emerging economies. Demand for graphene and products based on the material is anticipated to rise sharply throughout the forecast period as the global automotive industry is predicted to develop in the next ten years.
As per the Graphene Council, for instance, usage of graphene in a car’s supercapacitors may help enhance the performance of existing batteries, allowing for accelerating and charging quickly. In addition, using graphene composite in a car’s body can lower its total weight, thereby making it more efficient to operate.
Regional Analysis
- Asia Pacific to Lead with Supportive Government Policies in China
Asia Pacific is projected to emerge as the leader in the global graphene market, capturing an impressive 34% of the total share in 2025. This dominance is mainly driven by the region’s high demand for graphene in diverse automotive, marine, defense, and aerospace industries.
China is a key player in Asia Pacific, quickly becoming a central figure in the graphene market. The country’s government actively supports the market by introducing policies that promote investments in manufacturing and research and development.

- North America Sees High Demand from Aircraft Manufacturers
North America is projected to experience substantial expansion in the graphene market due to increasing demand from the aerospace and automotive industries. Key aircraft manufacturers, including Boeing, are concentrating on using lightweight composite materials like graphene to enhance their aircraft's efficiency and performance.
The U.S. is the predominant market in North America and a principal exporter of graphene-based products to other countries that lack graphene production capacity. In recent years, North America has observed several collaborations between manufacturers and research institutes due to an enhanced emphasis on research and development operations.
Fairfield’s Competitive Landscape Analysis
The competitive landscape of the graphene market is dynamic and increasingly competitive, with several key players driving innovation across various sectors. Leading companies are focusing on advancing graphene production techniques and extending their research and development capabilities to stay ahead.
Leading players are also forging strategic partnerships and collaborating with government institutions to scale production and enhance product offerings. Graphene producers are leveraging cutting-edge technologies to deliver high-quality graphene that meets growing demand from electronics, automotive, energy storage, and aerospace industries.
Key Market Companies
- Global Graphene Group
- First Graphene
- Directa Plus SpA
- Graphenea SA
- NanoXplore Inc.
- The Sixth Element Materials Technology Co. Ltd.
- Haydale Graphene Industries Plc
- ACS Materials
- Universal Matter Inc.
- XG Sciences
- Thomas Swan & Co. Ltd.
- Talga Group
Recent Industry Developments
- In January 2024, NanoXplore Inc. declared an expansion of manufacturing capacity at its St-Clotilde, QC facility to satisfy a current client's demand for enhanced graphene SMC components in an ongoing program.
- In June 2024, Avanzare and Tecnalia cooperated on the European Sunshine project to devise innovative Safe and Sustainable by Design (SSbD) techniques for graphene production.
Global Graphene Market is Segmented as-
By Product Type
- Few Layers Graphene (FLG)
- Graphene Oxide (GO)
- Graphene Nanoplatelets (GNP)
- Others
By Form
- Powder
- Liquid/Solution
- Others
By Production Process
- Exfoliation
- Chemical Vapor Deposition
- Pyrolysis
- Others
By End Use Industry
- Electronics
- Aerospace & Defense
- Energy
- Automotive
- Construction
- Others
By Region
- North America
- Europe
- Asia Pacific
- Latin America
- Middle East & Africa
1. Executive Summary
1.1. Global Graphene Market Snapshot
1.2. Future Projections
1.3. Key Market Trends
1.4. Regional Snapshot, by Value, 2025
1.5. Analyst Recommendations
2. Market Overview
2.1. Market Definitions and Segmentations
2.2. Market Dynamics
2.2.1. Drivers
2.2.2. Restraints
2.2.3. Market Opportunities
2.3. Value Chain Analysis
2.4. COVID-19 Impact Analysis
2.5. Porter's Fiver Forces Analysis
2.6. Impact of Russia-Ukraine Conflict
2.7. PESTLE Analysis
2.8. Regulatory Analysis
2.9. Price Trend Analysis
2.9.1. Current Prices and Future Projections, 2025-2032
2.9.2. Price Impact Factors
3. Global Graphene Market Outlook, 2019 - 2032
3.1. Global Graphene Market Outlook, by Product Type, Value (US$ Mn) & Volume (Tons), 2019-2032
3.1.1. Few Layers Graphene (FLG)
3.1.2. Graphene Oxide (GO)
3.1.3. Graphene Nanoplatelets (GNP)
3.1.4. Others
3.2. Global Graphene Market Outlook, by Form, Value (US$ Mn) & Volume (Tons), 2019-2032
3.2.1. Powder
3.2.2. Liquid/Solution
3.2.3. Others
3.3. Global Graphene Market Outlook, by Production Process, Value (US$ Mn) & Volume (Tons), 2019-2032
3.3.1. Exfoliation
3.3.2. Chemical Vapor Deposition
3.3.3. Pyrolysis
3.3.4. Others
3.4. Global Graphene Market Outlook, by End Use Industry, Value (US$ Mn) & Volume (Tons), 2019-2032
3.4.1. Electronics
3.4.2. Aerospace & Defense
3.4.3. Energy
3.4.4. Automotive
3.4.5. Construction
3.4.6. Others
3.5. Global Graphene Market Outlook, by Region, Value (US$ Mn) & Volume (Tons), 2019-2032
3.5.1. North America
3.5.2. Europe
3.5.3. Asia Pacific
3.5.4. Latin America
3.5.5. Middle East & Africa
4. North America Graphene Market Outlook, 2019 - 2032
4.1. North America Graphene Market Outlook, by Product Type, Value (US$ Mn) & Volume (Tons), 2019-2032
4.1.1. Few Layers Graphene (FLG)
4.1.2. Graphene Oxide (GO)
4.1.3. Graphene Nanoplatelets (GNP)
4.1.4. Others
4.2. North America Graphene Market Outlook, by Form, Value (US$ Mn) & Volume (Tons), 2019-2032
4.2.1. Powder
4.2.2. Liquid/Solution
4.2.3. Others
4.3. North America Graphene Market Outlook, by Production Process, Value (US$ Mn) & Volume (Tons), 2019-2032
4.3.1. Exfoliation
4.3.2. Chemical Vapor Deposition
4.3.3. Pyrolysis
4.3.4. Others
4.4. North America Graphene Market Outlook, by End Use Industry, Value (US$ Mn) & Volume (Tons), 2019-2032
4.4.1. Electronics
4.4.2. Aerospace & Defense
4.4.3. Energy
4.4.4. Automotive
4.4.5. Construction
4.4.6. Others
4.5. North America Graphene Market Outlook, by Country, Value (US$ Mn) & Volume (Tons), 2019-2032
4.5.1. U.S. Graphene Market Outlook, by Product Type, 2019-2032
4.5.2. U.S. Graphene Market Outlook, by Form, 2019-2032
4.5.3. U.S. Graphene Market Outlook, by Production Process, 2019-2032
4.5.4. U.S. Graphene Market Outlook, by End Use Industry, 2019-2032
4.5.5. Canada Graphene Market Outlook, by Product Type, 2019-2032
4.5.6. Canada Graphene Market Outlook, by Form, 2019-2032
4.5.7. Canada Graphene Market Outlook, by Production Process, 2019-2032
4.5.8. Canada Graphene Market Outlook, by End Use Industry, 2019-2032
4.6. BPS Analysis/Market Attractiveness Analysis
5. Europe Graphene Market Outlook, 2019 - 2032
5.1. Europe Graphene Market Outlook, by Product Type, Value (US$ Mn) & Volume (Tons), 2019-2032
5.1.1. Few Layers Graphene (FLG)
5.1.2. Graphene Oxide (GO)
5.1.3. Graphene Nanoplatelets (GNP)
5.1.4. Others
5.2. Europe Graphene Market Outlook, by Form, Value (US$ Mn) & Volume (Tons), 2019-2032
5.2.1. Powder
5.2.2. Liquid/Solution
5.2.3. Others
5.3. Europe Graphene Market Outlook, by Production Process, Value (US$ Mn) & Volume (Tons), 2019-2032
5.3.1. Exfoliation
5.3.2. Chemical Vapor Deposition
5.3.3. Pyrolysis
5.3.4. Others
5.4. Europe Graphene Market Outlook, by End Use Industry, Value (US$ Mn) & Volume (Tons), 2019-2032
5.4.1. Electronics
5.4.2. Aerospace & Defense
5.4.3. Energy
5.4.4. Automotive
5.4.5. Construction
5.4.6. Others
5.5. Europe Graphene Market Outlook, by Country, Value (US$ Mn) & Volume (Tons), 2019-2032
5.5.1. Germany Graphene Market Outlook, by Product Type, 2019-2032
5.5.2. Germany Graphene Market Outlook, by Form, 2019-2032
5.5.3. Germany Graphene Market Outlook, by Production Process, 2019-2032
5.5.4. Germany Graphene Market Outlook, by End Use Industry, 2019-2032
5.5.5. Italy Graphene Market Outlook, by Product Type, 2019-2032
5.5.6. Italy Graphene Market Outlook, by Form, 2019-2032
5.5.7. Italy Graphene Market Outlook, by Production Process, 2019-2032
5.5.8. Italy Graphene Market Outlook, by End Use Industry, 2019-2032
5.5.9. France Graphene Market Outlook, by Product Type, 2019-2032
5.5.10. France Graphene Market Outlook, by Form, 2019-2032
5.5.11. France Graphene Market Outlook, by Production Process, 2019-2032
5.5.12. France Graphene Market Outlook, by End Use Industry, 2019-2032
5.5.13. U.K. Graphene Market Outlook, by Product Type, 2019-2032
5.5.14. U.K. Graphene Market Outlook, by Form, 2019-2032
5.5.15. U.K. Graphene Market Outlook, by Production Process, 2019-2032
5.5.16. U.K. Graphene Market Outlook, by End Use Industry, 2019-2032
5.5.17. Spain Graphene Market Outlook, by Product Type, 2019-2032
5.5.18. Spain Graphene Market Outlook, by Form, 2019-2032
5.5.19. Spain Graphene Market Outlook, by Production Process, 2019-2032
5.5.20. Spain Graphene Market Outlook, by End Use Industry, 2019-2032
5.5.21. Russia Graphene Market Outlook, by Product Type, 2019-2032
5.5.22. Russia Graphene Market Outlook, by Form, 2019-2032
5.5.23. Russia Graphene Market Outlook, by Production Process, 2019-2032
5.5.24. Russia Graphene Market Outlook, by End Use Industry, 2019-2032
5.5.25. Rest of Europe Graphene Market Outlook, by Product Type, 2019-2032
5.5.26. Rest of Europe Graphene Market Outlook, by Form, 2019-2032
5.5.27. Rest of Europe Graphene Market Outlook, by Production Process, 2019-2032
5.5.28. Rest of Europe Graphene Market Outlook, by End Use Industry, 2019-2032
5.6. BPS Analysis/Market Attractiveness Analysis
6. Asia Pacific Graphene Market Outlook, 2019 - 2032
6.1. Asia Pacific Graphene Market Outlook, by Product Type, Value (US$ Mn) & Volume (Tons), 2019-2032
6.1.1. Few Layers Graphene (FLG)
6.1.2. Graphene Oxide (GO)
6.1.3. Graphene Nanoplatelets (GNP)
6.1.4. Others
6.2. Asia Pacific Graphene Market Outlook, by Form, Value (US$ Mn) & Volume (Tons), 2019-2032
6.2.1. Powder
6.2.2. Liquid/Solution
6.2.3. Others
6.3. Asia Pacific Graphene Market Outlook, by Production Process, Value (US$ Mn) & Volume (Tons), 2019-2032
6.3.1. Exfoliation
6.3.2. Chemical Vapor Deposition
6.3.3. Pyrolysis
6.3.4. Others
6.4. Asia Pacific Graphene Market Outlook, by End Use Industry, Value (US$ Mn) & Volume (Tons), 2019-2032
6.4.1. Electronics
6.4.2. Aerospace & Defense
6.4.3. Energy
6.4.4. Automotive
6.4.5. Construction
6.4.6. Others
6.5. Asia Pacific Graphene Market Outlook, by Country, Value (US$ Mn) & Volume (Tons), 2019-2032
6.5.1. China Graphene Market Outlook, by Product Type, 2019-2032
6.5.2. China Graphene Market Outlook, by Form, 2019-2032
6.5.3. China Graphene Market Outlook, by Production Process, 2019-2032
6.5.4. China Graphene Market Outlook, by End Use Industry, 2019-2032
6.5.5. Japan Graphene Market Outlook, by Product Type, 2019-2032
6.5.6. Japan Graphene Market Outlook, by Form, 2019-2032
6.5.7. Japan Graphene Market Outlook, by Production Process, 2019-2032
6.5.8. Japan Graphene Market Outlook, by End Use Industry, 2019-2032
6.5.9. South Korea Graphene Market Outlook, by Product Type, 2019-2032
6.5.10. South Korea Graphene Market Outlook, by Form, 2019-2032
6.5.11. South Korea Graphene Market Outlook, by Production Process, 2019-2032
6.5.12. South Korea Graphene Market Outlook, by End Use Industry, 2019-2032
6.5.13. India Graphene Market Outlook, by Product Type, 2019-2032
6.5.14. India Graphene Market Outlook, by Form, 2019-2032
6.5.15. India Graphene Market Outlook, by Production Process, 2019-2032
6.5.16. India Graphene Market Outlook, by End Use Industry, 2019-2032
6.5.17. Southeast Asia Graphene Market Outlook, by Product Type, 2019-2032
6.5.18. Southeast Asia Graphene Market Outlook, by Form, 2019-2032
6.5.19. Southeast Asia Graphene Market Outlook, by Production Process, 2019-2032
6.5.20. Southeast Asia Graphene Market Outlook, by End Use Industry, 2019-2032
6.5.21. Rest of SAO Graphene Market Outlook, by Product Type, 2019-2032
6.5.22. Rest of SAO Graphene Market Outlook, by Form, 2019-2032
6.5.23. Rest of SAO Graphene Market Outlook, by Production Process, 2019-2032
6.5.24. Rest of SAO Graphene Market Outlook, by End Use Industry, 2019-2032
6.6. BPS Analysis/Market Attractiveness Analysis
7. Latin America Graphene Market Outlook, 2019 - 2032
7.1. Latin America Graphene Market Outlook, by Product Type, Value (US$ Mn) & Volume (Tons), 2019-2032
7.1.1. Few Layers Graphene (FLG)
7.1.2. Graphene Oxide (GO)
7.1.3. Graphene Nanoplatelets (GNP)
7.1.4. Others
7.2. Latin America Graphene Market Outlook, by Form, Value (US$ Mn) & Volume (Tons), 2019-2032
7.2.1. Powder
7.2.2. Liquid/Solution
7.2.3. Others
7.3. Latin America Graphene Market Outlook, by Production Process, Value (US$ Mn) & Volume (Tons), 2019-2032
7.3.1. Exfoliation
7.3.2. Chemical Vapor Deposition
7.3.3. Pyrolysis
7.3.4. Others
7.4. Latin America Graphene Market Outlook, by End Use Industry, Value (US$ Mn) & Volume (Tons), 2019-2032
7.4.1. Electronics
7.4.2. Aerospace & Defense
7.4.3. Energy
7.4.4. Automotive
7.4.5. Construction
7.4.6. Others
7.5. Latin America Graphene Market Outlook, by Country, Value (US$ Mn) & Volume (Tons), 2019-2032
7.5.1. Brazil Graphene Market Outlook, by Product Type, 2019-2032
7.5.2. Brazil Graphene Market Outlook, by Form, 2019-2032
7.5.3. Brazil Graphene Market Outlook, by Production Process, 2019-2032
7.5.4. Brazil Graphene Market Outlook, by End Use Industry, 2019-2032
7.5.5. Mexico Graphene Market Outlook, by Product Type, 2019-2032
7.5.6. Mexico Graphene Market Outlook, by Form, 2019-2032
7.5.7. Mexico Graphene Market Outlook, by Production Process, 2019-2032
7.5.8. Mexico Graphene Market Outlook, by End Use Industry, 2019-2032
7.5.9. Argentina Graphene Market Outlook, by Product Type, 2019-2032
7.5.10. Argentina Graphene Market Outlook, by Form, 2019-2032
7.5.11. Argentina Graphene Market Outlook, by Production Process, 2019-2032
7.5.12. Argentina Graphene Market Outlook, by End Use Industry, 2019-2032
7.5.13. Rest of LATAM Graphene Market Outlook, by Product Type, 2019-2032
7.5.14. Rest of LATAM Graphene Market Outlook, by Form, 2019-2032
7.5.15. Rest of LATAM Graphene Market Outlook, by Production Process, 2019-2032
7.5.16. Rest of LATAM Graphene Market Outlook, by End Use Industry, 2019-2032
7.6. BPS Analysis/Market Attractiveness Analysis
8. Middle East & Africa Graphene Market Outlook, 2019 - 2032
8.1. Middle East & Africa Graphene Market Outlook, by Product Type, Value (US$ Mn) & Volume (Tons), 2019-2032
8.1.1. Few Layers Graphene (FLG)
8.1.2. Graphene Oxide (GO)
8.1.3. Graphene Nanoplatelets (GNP)
8.1.4. Others
8.2. Middle East & Africa Graphene Market Outlook, by Form, Value (US$ Mn) & Volume (Tons), 2019-2032
8.2.1. Powder
8.2.2. Liquid/Solution
8.2.3. Others
8.3. Middle East & Africa Graphene Market Outlook, by Production Process, Value (US$ Mn) & Volume (Tons), 2019-2032
8.3.1. Exfoliation
8.3.2. Chemical Vapor Deposition
8.3.3. Pyrolysis
8.3.4. Others
8.4. Middle East & Africa Graphene Market Outlook, by End Use Industry, Value (US$ Mn) & Volume (Tons), 2019-2032
8.4.1. Electronics
8.4.2. Aerospace & Defense
8.4.3. Energy
8.4.4. Automotive
8.4.5. Construction
8.4.6. Others
8.5. Middle East & Africa Graphene Market Outlook, by Country, Value (US$ Mn) & Volume (Tons), 2019-2032
8.5.1. GCC Graphene Market Outlook, by Product Type, 2019-2032
8.5.2. GCC Graphene Market Outlook, by Form, 2019-2032
8.5.3. GCC Graphene Market Outlook, by Production Process, 2019-2032
8.5.4. GCC Graphene Market Outlook, by End Use Industry, 2019-2032
8.5.5. South Africa Graphene Market Outlook, by Product Type, 2019-2032
8.5.6. South Africa Graphene Market Outlook, by Form, 2019-2032
8.5.7. South Africa Graphene Market Outlook, by Production Process, 2019-2032
8.5.8. South Africa Graphene Market Outlook, by End Use Industry, 2019-2032
8.5.9. Egypt Graphene Market Outlook, by Product Type, 2019-2032
8.5.10. Egypt Graphene Market Outlook, by Form, 2019-2032
8.5.11. Egypt Graphene Market Outlook, by Production Process, 2019-2032
8.5.12. Egypt Graphene Market Outlook, by End Use Industry, 2019-2032
8.5.13. Nigeria Graphene Market Outlook, by Product Type, 2019-2032
8.5.14. Nigeria Graphene Market Outlook, by Form, 2019-2032
8.5.15. Nigeria Graphene Market Outlook, by Production Process, 2019-2032
8.5.16. Nigeria Graphene Market Outlook, by End Use Industry, 2019-2032
8.5.17. Rest of Middle East Graphene Market Outlook, by Product Type, 2019-2032
8.5.18. Rest of Middle East Graphene Market Outlook, by Form, 2019-2032
8.5.19. Rest of Middle East Graphene Market Outlook, by Production Process, 2019-2032
8.5.20. Rest of Middle East Graphene Market Outlook, by End Use Industry, 2019-2032
8.6. BPS Analysis/Market Attractiveness Analysis
9. Competitive Landscape
9.1. Company Vs Segment Heatmap
9.2. Company Market Share Analysis, 2025
9.3. Competitive Dashboard
9.4. Company Profiles
9.4.1. Global Graphene Group
9.4.1.1. Company Overview
9.4.1.2. Product Portfolio
9.4.1.3. Financial Overview
9.4.1.4. Business Strategies and Developments
9.4.2. First Graphene
9.4.3. Directa Plus SpA
9.4.4. Graphenea SA
9.4.5. NanoXplore Inc.
9.4.6. The Sixth Element Materials Technology Co. Ltd.
9.4.7. Haydale Graphene Industries Plc
9.4.8. ACS Materials
9.4.9. Universal Matter Inc.
9.4.10. XG Sciences
9.4.11. Thomas Swan & Co. Ltd.
9.4.12. Talga Group
10. Appendix
10.1. Research Methodology
10.2. Report Assumptions
10.3. Acronyms and Abbreviations
|
BASE YEAR |
HISTORICAL DATA |
FORECAST PERIOD |
UNITS |
|||
|
2024 |
|
2019 - 2023 |
2025 - 2032 |
Value: US$ Million |
||
|
REPORT FEATURES |
DETAILS |
|
Product Type Coverage |
|
|
Form Coverage |
|
|
Production Process Coverage |
|
|
End Use Industry Coverage |
|
|
Geographical Coverage |
|
|
Leading Companies |
|
|
Report Highlights |
Key Market Indicators, Macro-micro economic impact analysis, Technological Roadmap, Key Trends, Driver, Restraints, and Future Opportunities & Revenue Pockets, Porter’s 5 Forces Analysis, Historical Trend (2019-2023), Market Estimates and Forecast, Market Dynamics, Industry Trends, Competition Landscape, Category, Region, Country-wise Trends & Analysis, COVID-19 Impact Analysis (Demand and Supply Chain) |
