Global Virtual Power Plant Market Forecast
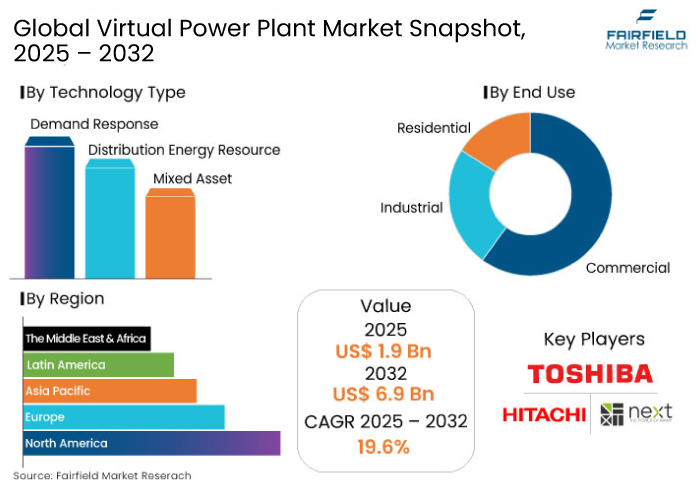
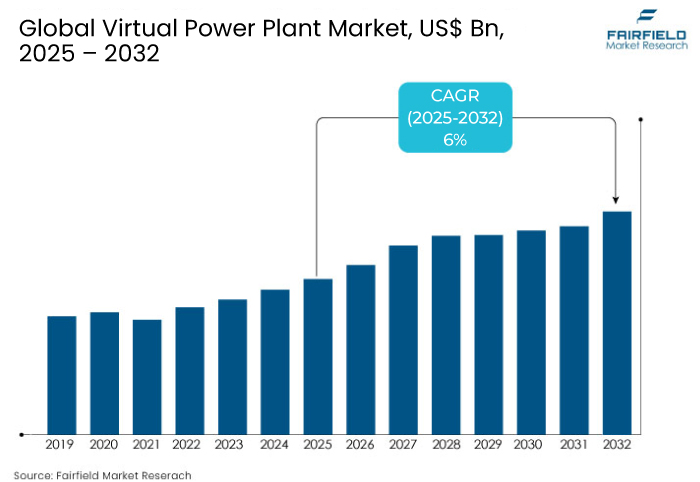
- The virtual power plant market is estimated to reach US$ 1.9 Bn in 2025 and attain US$ 6.9 Bn by 2032.
- The virtual power plant market is projected to witness a CAGR of 6% from 2025 to 2032.

Virtual Power Plant Market Insights
- Increasing adoption of renewable energy sources like solar and wind power.
- Rising need for energy efficiency and optimized grid management solutions.
- Expansion of virtual power plants in emerging markets with rising renewable energy adoption.
- Increased collaboration between utility companies and technology providers.
- Growth in demand for virtual power plants to balance energy supply and demand during peak periods.
- Increased collaboration between utility companies and technology providers.
- By technology type, the demand response segment is anticipated to lead with 62.9% share in 2025.
- By end use, the residential segment is projected to hold a share of 38.5% in 2025.
- The virtual power plant market showcased a CAGR of 17.4% in the historical period.
Key Growth Determinants
- Innovations in Digital Technology and Grid Decentralization
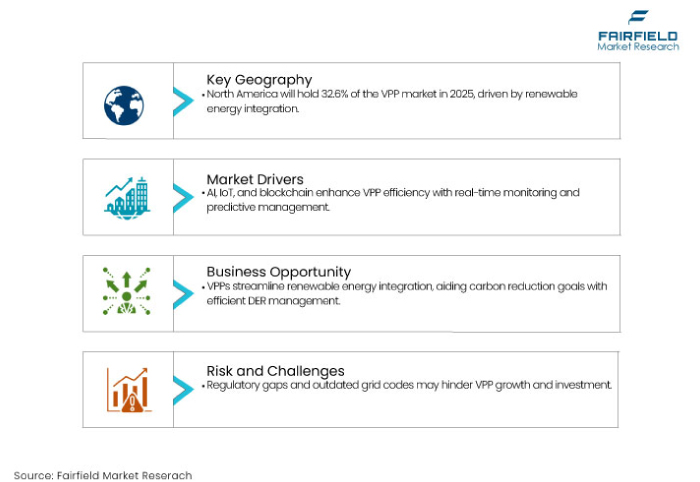
The operational efficiency of Virtual Power Plants (VPPs) is being improved by technologies such as blockchain, Artificial Intelligence (AI), and the Internet of Things (IoT). By enabling data analysis, predictive energy management, and real-time monitoring, these technologies increase the scalability and dependability of VPPs.
Meeting peak demand and controlling the unpredictability of renewable energy present difficulties for conventional centralized power systems. In order to provide load balancing, grid flexibility, and auxiliary services, VPPs combine dispersed resources. Owing to the aforementioned factors, the virtual power plant market is set to show steady growth.
- Environmental and Economic Benefits
VPPs offer cost savings by reducing the need for investment in new power plants and grid infrastructure. Utilities can rely on VPPs to manage peak loads and defer costly upgrades. By enabling greater use of renewable energy and reducing reliance on fossil fuel-based power generation, VPPs contribute to carbon emission reductions, aligning with global climate goals.
By offering backup power and grid stabilization services, VPPs improve energy resilience as extreme weather events and grid outages become more frequent. VPPs with battery storage systems can store extra renewable energy and release it during blackouts or periods of high demand. The above-mentioned factors are anticipated to propel the virtual power plant market by 2032.

Key Growth Barriers
- Policy Changes and Market Saturation in Developed Regions
The virtual power plant market may be hampered by the uneven regulatory environment in several areas. Sometimes the effectiveness of VPPs is restricted by out-of-date grid codes, ambiguous laws regarding the integration of Distributed Energy Resources (DERs). For example, investment and involvement in VPP initiatives may stall if governments do not provide incentives for decentralized energy systems or do not acknowledge the importance of VPPs in energy markets.
VPP implementation may have peaked in developed energy markets like parts of Europe and North America, especially in regions with high levels of DER adoption and renewable energy integration. Further growth may necessitate substantial innovation or broader applications once the initial wave of adoption declines, which could postpone the increase of VPP demand.
Virtual Power Plant Market Trends and Opportunities
- Integration into Smart Appliances and Home Batteries
Renewable energy sources like solar and wind have become more integrated into the grid as countries work to reach their carbon reduction goals. By combining Distributed Energy Resources (DERs), VPPs make this shift easier and enable more effective management of renewable outputs.
The trend of consumer involvement in energy markets is on the rise. In order to optimize energy use and offer demand response services, VPPs can make use of consumer-owned resources like smart appliances and home batteries. This makes the energy ecosystem more dynamic, thereby bolstering the virtual power plant market growth.
- Collaboration Efforts and Energy Storage Investments
Utilities, energy service providers, and technology providers could form beneficial alliances. Partnerships can increase VPPs' technological prowess and broaden their customer base. There will be chances to invest in infrastructure that facilitates grid modernization and DER integration as the demand for VPPs rises. To support distributed generating, this entails modernizing the transmission and distribution networks.
VPPs have the chance to improve grid stability and dependability as energy storage technologies, like batteries, proliferate. VPPs can provide energy during times of high demand by storing excess energy produced during peak production periods. The virtual power plant market is anticipated to see investments in novel management solutions.

Segments Covered in the Report
- Demand Response Gains Traction with Decarbonization Goals
By technology type, the demand response segment is set to dominate the global virtual power plant market by 2032. Power grids now experience instability and intermittency as a result of the rapid growth of renewable energy sources like wind and solar. By allowing for dynamic adjustments in electricity consumption to match the availability of renewable energy, demand response helps balance these variations.
Demand response programs, for example, might encourage users to charge electric vehicles or use energy-intensive appliances during times of excess solar generation. It is projected to lower dependency on backup power derived from fossil fuels. Achieving decarbonization objectives and improving the financial feasibility of renewable energy projects depend on this factor.
- Residential Segment to Lead Amid Rooftop Solar Panel Installations
The residential end use segment is anticipated to witness a steady growth rate in the virtual power plant market. Distributed Energy Resources (DERs) like Electric Vehicles (EVs), battery storage systems, and rooftop solar panels are surging significantly in the residential sector.
The resources are ideal additions to VPPs since they have the ability to produce, store, and distribute electricity. By combining energy from different sources, VPPs lessen dependency on centralized fossil fuel power plants and empower homes to take an active role in the energy environment. For example, VPPs incorporate Tesla's Powerwall systems, which are frequently installed in houses, to provide electricity during times of high demand.
Regional Analysis
- North America Sees Increasing Shift toward Renewable Energy
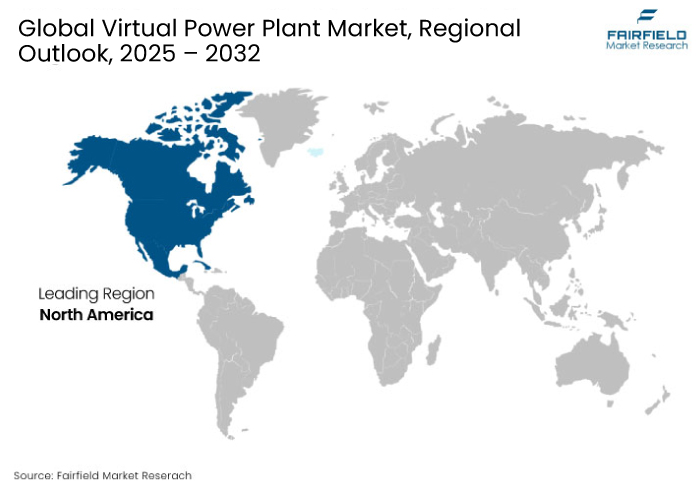
North America is set to generate a virtual power plant market share of 32.6% in 2025. The substantial transition to renewable energy sources is one of the main factors driving demand for VPP in North America. The need to successfully integrate these variable energy sources into the grid is surging as states and provinces establish new renewable energy targets.
A more dependable and steady energy supply is made possible by VPPs, which enable the aggregation of Distributed Energy Resources (DERs), including energy storage devices, wind turbines, and solar panels. VPPs can ensure a steady energy flow by mitigating the volatility of renewable energy generation by controlling these resources jointly.

- Energy Security and Resilience to Support Demand in Asia Pacific
Asia Pacific is anticipated to hold a share of 26.4% in the virtual power plant market in 2025. Several Asia Pacific nations are very concerned about energy security, especially those that depend on imported fossil fuels.
By lowering reliance on centralized power generation and diversifying energy sources, VPPs improve energy resilience. VPPs also help provide a more stable and secure energy supply by leveraging locally accessible renewable resources. This is especially important in areas where traditional energy infrastructure may be under risk from natural disasters.
Fairfield’s Competitive Landscape Analysis
The competitive landscape of the virtual power plant market is dynamic, with a mix of established energy companies, technology providers, and start-ups vying for share. To take advantage of Distributed Energy Resources (DERs) like solar panels, wind turbines, and battery storage systems, leading utility companies including Engie, Siemens, and General Electric are actively investing in VPP solutions.
Businesses that specialize in offering cutting-edge energy management platforms, Internet of Things technologies, and AI-driven analytics for optimizing VPP operations include Schneider Electric, ABB, and AutoGrid. Start-ups like Sunverge Energy and Next Kraftwerke are committed to creating cutting-edge software solutions that will improve the adaptability and scalability of VPPs.
Key Market Companies
- Next Kraftwerke GmbH
- Hitachi Ltd.
- TOSHIBA CORPORATION
- Siemens
- ABB
- Tesla
- Limejump Limited
- Sunverge Energy, Inc.
- Centrica plc
- AutoGrid Systems, Inc.
Recent Industry Developments
- In January 2025, a new power purchase agreement (VPA) in Texas's ERCOT market was announced by Sonnen and SOLRITE Energy. More Texans can now get solar and battery power due to this program, which provides households with these resources at a reasonable monthly cost.
- In January 2025, after successfully installing one of Australia's first Virtual Power Plants (VPPs) at its resorts in Torquay and Inverloch, RACV started offering VPPs as a new option for business clients.
Global Virtual Power Plant Market is Segmented as-
By Technology Type
- Demand Response
- Distribution Energy Resource
- Mixed Asset
By End Use
- Commercial
- Industrial
- Residential
By Region
- North America
- Europe
- Asia Pacific
- Latin America
- Middle East & Africa
1. Executive Summary
1.1. Global Virtual Power Plant Market Snapshot
1.2. Future Projections
1.3. Key Market Trends
1.4. Regional Snapshot, by Value, 2025
1.5. Analyst Recommendations
2. Market Overview
2.1. Market Definitions and Segmentations
2.2. Market Dynamics
2.2.1. Drivers
2.2.2. Restraints
2.2.3. Market Opportunities
2.3. Value Chain Analysis
2.4. Porter’s Five Forces Analysis
2.5. COVID-19 Impact Analysis
2.5.1. Supply
2.5.2. Demand
2.6. Impact of Ukraine-Russia Conflict
2.7. Economic Overview
2.7.1. World Economic Projections
2.8. PESTLE Analysis
3. Global Virtual Power Plant Market Outlook, 2019 - 2032
3.1. Global Virtual Power Plant Market Outlook, by Technology Type, Value (US$ Bn), 2019 - 2032
3.1.1. Key Highlights
3.1.1.1. Demand Response
3.1.1.2. Distributed Energy Resource
3.1.1.3. Mixed Asset
3.2. Global Virtual Power Plant Market Outlook, by End Use, Value (US$ Bn), 2019 - 2032
3.2.1. Key Highlights
3.2.1.1. Commercial
3.2.1.2. Industrial
3.2.1.3. Residential
3.3. Global Virtual Power Plant Market Outlook, by Region, Value (US$ Bn), 2019 - 2032
3.3.1. Key Highlights
3.3.1.1. North America
3.3.1.2. Europe
3.3.1.3. Asia Pacific
3.3.1.4. Latin America
3.3.1.5. Middle East & Africa
4. North America Virtual Power Plant Market Outlook, 2019 - 2032
4.1. North America Virtual Power Plant Market Outlook, by Technology Type, Value (US$ Bn), 2019 - 2032
4.1.1. Key Highlights
4.1.1.1. Demand Response
4.1.1.2. Distributed Energy Resource
4.1.1.3. Mixed Asset
4.2. North America Virtual Power Plant Market Outlook, by End Use, Value (US$ Bn), 2019 - 2032
4.2.1. Key Highlights
4.2.1.1. Commercial
4.2.1.2. Industrial
4.2.1.3. Residential
4.2.2. BPS Analysis/Market Attractiveness Analysis
4.3. North America Virtual Power Plant Market Outlook, by Country, Value (US$ Bn), 2019 - 2032
4.3.1. Key Highlights
4.3.1.1. U.S. Virtual Power Plant Market by Technology Type, Value (US$ Bn), 2019 - 2032
4.3.1.2. U.S. Virtual Power Plant Market by End Use, Value (US$ Bn), 2019 - 2032
4.3.1.3. Canada Virtual Power Plant Market by Technology Type, Value (US$ Bn), 2019 - 2032
4.3.1.4. Canada Virtual Power Plant Market by End Use, Value (US$ Bn), 2019 - 2032
4.3.2. BPS Analysis/Market Attractiveness Analysis
5. Europe Virtual Power Plant Market Outlook, 2019 - 2032
5.1. Europe Virtual Power Plant Market Outlook, by Technology Type, Value (US$ Bn), 2019 - 2032
5.1.1. Key Highlights
5.1.1.1. Demand Response
5.1.1.2. Distributed Energy Resource
5.1.1.3. Mixed Asset
5.2. Europe Virtual Power Plant Market Outlook, by End Use, Value (US$ Bn), 2019 - 2032
5.2.1. Key Highlights
5.2.1.1. Commercial
5.2.1.2. Industrial
5.2.1.3. Residential
5.2.2. BPS Analysis/Market Attractiveness Analysis
5.3. Europe Virtual Power Plant Market Outlook, by Country, Value (US$ Bn), 2019 - 2032
5.3.1. Key Highlights
5.3.1.1. Germany Virtual Power Plant Market by Technology Type, Value (US$ Bn), 2019 - 2032
5.3.1.2. Germany Virtual Power Plant Market by End Use, Value (US$ Bn), 2019 - 2032
5.3.1.3. U.K. Virtual Power Plant Market by Technology Type, Value (US$ Bn), 2019 - 2032
5.3.1.4. U.K. Virtual Power Plant Market by End Use, Value (US$ Bn), 2019 - 2032
5.3.1.5. France Virtual Power Plant Market by Technology Type, Value (US$ Bn), 2019 - 2032
5.3.1.6. France Virtual Power Plant Market by End Use, Value (US$ Bn), 2019 - 2032
5.3.1.7. Italy Virtual Power Plant Market by Technology Type, Value (US$ Bn), 2019 - 2032
5.3.1.8. Italy Virtual Power Plant Market by End Use, Value (US$ Bn), 2019 - 2032
5.3.1.9. Turkey Virtual Power Plant Market by Technology Type, Value (US$ Bn), 2019 - 2032
5.3.1.10. Turkey Virtual Power Plant Market by End Use, Value (US$ Bn), 2019 - 2032
5.3.1.11. Russia Virtual Power Plant Market by Technology Type, Value (US$ Bn), 2019 - 2032
5.3.1.12. Russia Virtual Power Plant Market by End Use, Value (US$ Bn), 2019 - 2032
5.3.1.13. Rest of Europe Virtual Power Plant Market by Technology Type, Value (US$ Bn), 2019 - 2032
5.3.1.14. Rest of Europe Virtual Power Plant Market by End Use, Value (US$ Bn), 2019 - 2032
5.3.2. BPS Analysis/Market Attractiveness Analysis
6. Asia Pacific Virtual Power Plant Market Outlook, 2019 - 2032
6.1. Asia Pacific Virtual Power Plant Market Outlook, by Technology Type, Value (US$ Bn), 2019 - 2032
6.1.1. Key Highlights
6.1.1.1. Demand Response
6.1.1.2. Distributed Energy Resource
6.1.1.3. Mixed Asset
6.2. Asia Pacific Virtual Power Plant Market Outlook, by End Use, Value (US$ Bn), 2019 - 2032
6.2.1. Key Highlights
6.2.1.1. Commercial
6.2.1.2. Industrial
6.2.1.3. Residential
6.2.2. BPS Analysis/Market Attractiveness Analysis
6.3. Asia Pacific Virtual Power Plant Market Outlook, by Country, Value (US$ Bn), 2019 - 2032
6.3.1. Key Highlights
6.3.1.1. China Virtual Power Plant Market by Technology Type, Value (US$ Bn), 2019 - 2032
6.3.1.2. China Virtual Power Plant Market by End Use, Value (US$ Bn), 2019 - 2032
6.3.1.3. Japan Virtual Power Plant Market by Technology Type, Value (US$ Bn), 2019 - 2032
6.3.1.4. Japan Virtual Power Plant Market by End Use, Value (US$ Bn), 2019 - 2032
6.3.1.5. South Korea Virtual Power Plant Market by Technology Type, Value (US$ Bn), 2019 - 2032
6.3.1.6. South Korea Virtual Power Plant Market by End Use, Value (US$ Bn), 2019 - 2032
6.3.1.7. India Virtual Power Plant Market by Technology Type, Value (US$ Bn), 2019 - 2032
6.3.1.8. India Virtual Power Plant Market by End Use, Value (US$ Bn), 2019 - 2032
6.3.1.9. Southeast Asia Virtual Power Plant Market by Technology Type, Value (US$ Bn), 2019 - 2032
6.3.1.10. Southeast Asia Virtual Power Plant Market by End Use, Value (US$ Bn), 2019 - 2032
6.3.1.11. Rest of Asia Pacific Virtual Power Plant Market by Technology Type, Value (US$ Bn), 2019 - 2032
6.3.1.12. Rest of Asia Pacific Virtual Power Plant Market by End Use, Value (US$ Bn), 2019 - 2032
6.3.2. BPS Analysis/Market Attractiveness Analysis
7. Latin America Virtual Power Plant Market Outlook, 2019 - 2032
7.1. Latin America Virtual Power Plant Market Outlook, by Technology Type, Value (US$ Bn), 2019 - 2032
7.1.1. Key Highlights
7.1.1.1. Demand Response
7.1.1.2. Distributed Energy Resource
7.1.1.3. Mixed Asset
7.2. Latin America Virtual Power Plant Market Outlook, by End Use, Value (US$ Bn), 2019 - 2032
7.2.1. Key Highlights
7.2.1.1. Commercial
7.2.1.2. Industrial
7.2.1.3. Residential
7.2.2. BPS Analysis/Market Attractiveness Analysis
7.3. Latin America Virtual Power Plant Market Outlook, by Country, Value (US$ Bn), 2019 - 2032
7.3.1. Key Highlights
7.3.1.1. Brazil Virtual Power Plant Market by Technology Type, Value (US$ Bn), 2019 - 2032
7.3.1.2. Brazil Virtual Power Plant Market by End Use, Value (US$ Bn), 2019 - 2032
7.3.1.3. Mexico Virtual Power Plant Market by Technology Type, Value (US$ Bn), 2019 - 2032
7.3.1.4. Mexico Virtual Power Plant Market by End Use, Value (US$ Bn), 2019 - 2032
7.3.1.5. Argentina Virtual Power Plant Market by Technology Type, Value (US$ Bn), 2019 - 2032
7.3.1.6. Argentina Virtual Power Plant Market by End Use, Value (US$ Bn), 2019 - 2032
7.3.1.7. Rest of Latin America Virtual Power Plant Market by Technology Type, Value (US$ Bn), 2019 - 2032
7.3.1.8. Rest of Latin America Virtual Power Plant Market by End Use, Value (US$ Bn), 2019 - 2032
7.3.2. BPS Analysis/Market Attractiveness Analysis
8. Middle East & Africa Virtual Power Plant Market Outlook, 2019 - 2032
8.1. Middle East & Africa Virtual Power Plant Market Outlook, by Technology Type, Value (US$ Bn), 2019 - 2032
8.1.1. Key Highlights
8.1.1.1. Demand Response
8.1.1.2. Distributed Energy Resource
8.1.1.3. Mixed Asset
8.2. Middle East & Africa Virtual Power Plant Market Outlook, by End Use, Value (US$ Bn), 2019 - 2032
8.2.1. Key Highlights
8.2.1.1. Commercial
8.2.1.2. Industrial
8.2.1.3. Residential
8.2.2. BPS Analysis/Market Attractiveness Analysis
8.3. Middle East & Africa Virtual Power Plant Market Outlook, by Country, Value (US$ Bn), 2019 - 2032
8.3.1. Key Highlights
8.3.1.1. GCC Virtual Power Plant Market by Technology Type, Value (US$ Bn), 2019 - 2032
8.3.1.2. GCC Virtual Power Plant Market by End Use, Value (US$ Bn), 2019 - 2032
8.3.1.3. South Africa Virtual Power Plant Market by Technology Type, Value (US$ Bn), 2019 - 2032
8.3.1.4. South Africa Virtual Power Plant Market by End Use, Value (US$ Bn), 2019 - 2032
8.3.1.5. Egypt Virtual Power Plant Market by Technology Type, Value (US$ Bn), 2019 - 2032
8.3.1.6. Egypt Virtual Power Plant Market by End Use, Value (US$ Bn), 2019 - 2032
8.3.1.7. Nigeria Virtual Power Plant Market by Technology Type, Value (US$ Bn), 2019 - 2032
8.3.1.8. Nigeria Virtual Power Plant Market by End Use, Value (US$ Bn), 2019 - 2032
8.3.1.9. Rest of Middle East & Africa Virtual Power Plant Market by Technology Type, Value (US$ Bn), 2019 - 2032
8.3.1.10. Rest of Middle East & Africa Virtual Power Plant Market by End Use, Value (US$ Bn), 2019 - 2032
8.3.2. BPS Analysis/Market Attractiveness Analysis
9. Competitive Landscape
9.1. Company Market Share Analysis, 2025
9.2. Competitive Dashboard
9.3. Company Profiles
9.3.1. Next Kraftwerke GmbH
9.3.1.1. Company Overview
9.3.1.2. Therapy Portfolio
9.3.1.3. Financial Overview
9.3.1.4. Business Strategies and Development
9.3.2. Hitachi Ltd.
9.3.2.1. Company Overview
9.3.2.2. Therapy Portfolio
9.3.2.3. Financial Overview
9.3.2.4. Business Strategies and Development
9.3.3. TOSHIBA CORPORATION
9.3.3.1. Company Overview
9.3.3.2. Therapy Portfolio
9.3.3.3. Financial Overview
9.3.3.4. Business Strategies and Development
9.3.4. Siemens
9.3.4.1. Company Overview
9.3.4.2. Therapy Portfolio
9.3.4.3. Financial Overview
9.3.4.4. Business Strategies and Development
9.3.5. ABB
9.3.5.1. Company Overview
9.3.5.2. Therapy Portfolio
9.3.5.3. Financial Overview
9.3.5.4. Business Strategies and Development
9.3.6. Tesla
9.3.6.1. Company Overview
9.3.6.2. Therapy Portfolio
9.3.6.3. Financial Overview
9.3.6.4. Business Strategies and Development
9.3.7. Limejump Limited
9.3.7.1. Company Overview
9.3.7.2. Therapy Portfolio
9.3.7.3. Financial Overview
9.3.7.4. Business Strategies and Development
9.3.8. Sunverge Energy, Inc.
9.3.8.1. Company Overview
9.3.8.2. Therapy Portfolio
9.3.8.3. Financial Overview
9.3.8.4. Business Strategies and Development
9.3.9. Centrica plc
9.3.9.1. Company Overview
9.3.9.2. Therapy Portfolio
9.3.9.3. Financial Overview
9.3.9.4. Business Strategies and Development
9.3.10. AutoGrid Systems, Inc.
9.3.10.1. Company Overview
9.3.10.2. Therapy Portfolio
9.3.10.3. Financial Overview
9.3.10.4. Business Strategies and Development
10. Appendix
10.1. Research Methodology
10.2. Report Assumptions
10.3. Acronyms and Abbreviations
|
BASE YEAR |
HISTORICAL DATA |
FORECAST PERIOD |
UNITS |
|||
|
2024 |
|
2019 - 2023 |
2025 - 2032 |
Value: US$ Billion |
||
|
REPORT FEATURES |
DETAILS |
|
Technology Type Coverage |
|
|
End Use Coverage |
|
|
Geographical Coverage |
|
|
Leading Companies |
|
|
Report Highlights |
Key Market Indicators, Macro-micro economic impact analysis, Technological Roadmap, Key Trends, Driver, Restraints, and Future Opportunities & Revenue Pockets, Porter’s 5 Forces Analysis, Historical Trend (2019-2023), Market Estimates and Forecast, Market Dynamics, Industry Trends, Competition Landscape, Category, Region, Country-wise Trends & Analysis, COVID-19 Impact Analysis (Demand and Supply Chain) |
